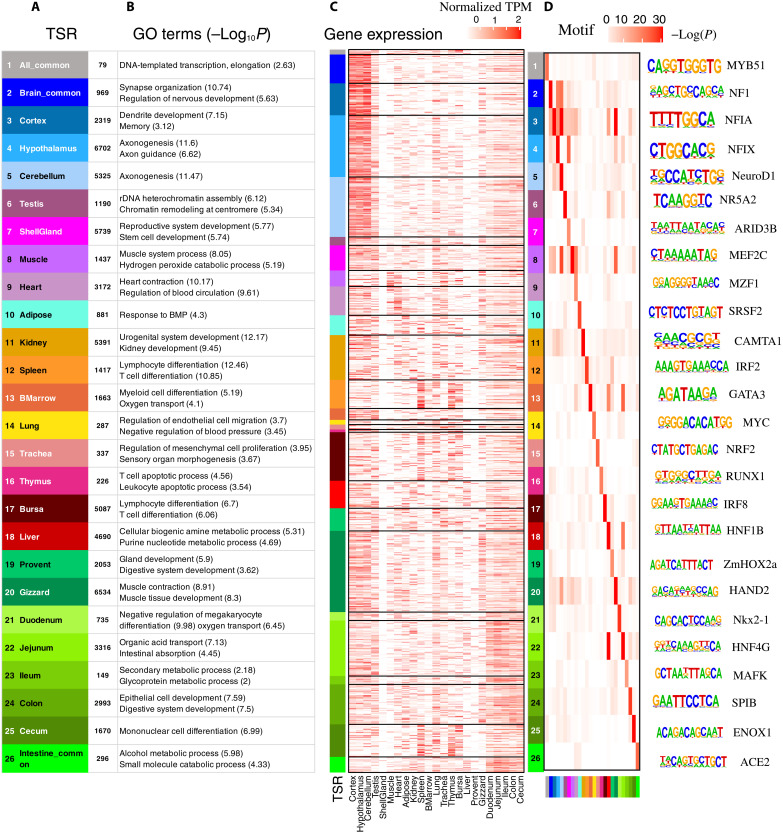
Fig. 3. Tissue-specific strong enhancers (EnhA) and their potential functions in 23 tissues.
(A) Twenty-six modules of tissue-specific strong enhancers (EnhA) and their number in each module. (B) The GO functional enrichment for target genes of tissue-specific strong enhancers in each module. The columns represent 26 modules of strong enhancers. The rows represent GO terms in each module. (C) The expression (TPM) of EnhAs’ putative target genes within the top three GO terms of each module. The rows represent the target genes within the top GO terms of each module, and the columns represent each tissue. (D) The enrichment of transcription factor motifs in each module. The columns represent 26 modules of EnhAs. The rows represent motifs in each module.

