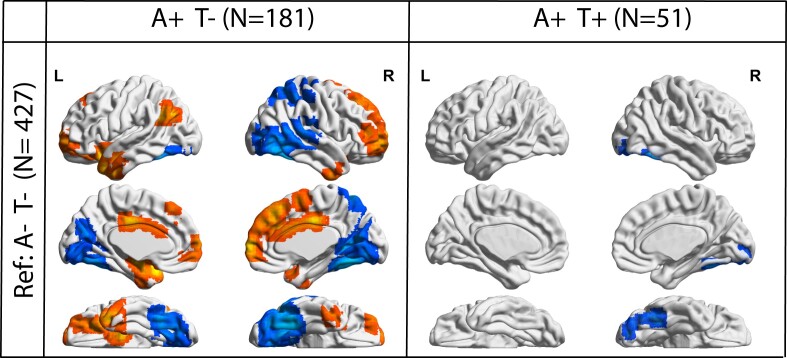
Figure 3.
Static eigenvector centrality differences in AT groups. Surface plots of P-values in statistical significant clusters. Left: Regions showing increased (red) or decreased (blue) EC in A+T- participants compared to A-T-. Right: Regions showing increased (red) or decreased (blue) EC in A+T+ participants compared to A-T-. Upper one is the lateral view, middle row is the medial view, lower row is ventral view. Abbreviations: Ref = Reference group; A-T- = Amyloid negative Tau negative; A+T- = Amyloid positive Tau negative; A+T+ = Amyloid positive Tau positive.

