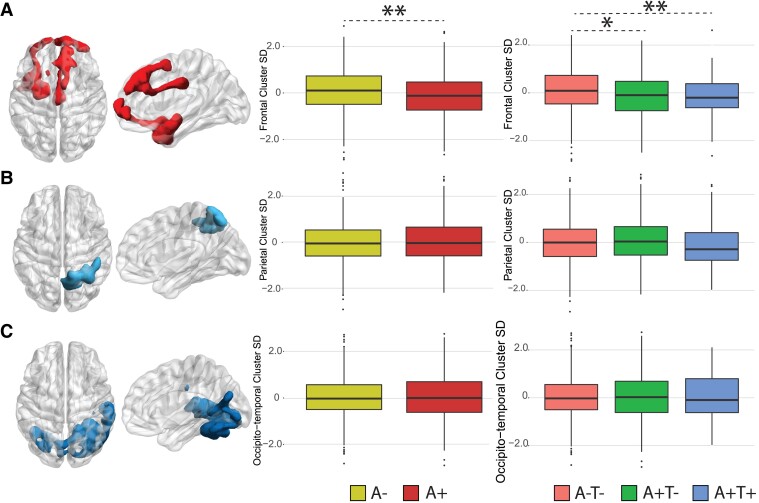
Figure 4.
Dynamic EC variability measured within static clusters. Rendering of significant clusters from the static analysis and differences (linear models) in within-cluster dynamic EC standard deviation between amyloid for the frontotemporal (A), parietal (B), and occipito-temporal (C) clusters. Abbreviations: SD = Standard deviation; A+ = Amyloid positive; A- = Amyloid negative; A-T- = Amyloid negative Tau negative; A+T- = Amyloid positive Tau negative; A+T+ = Amyloid positive Tau positive. * = P < 0.05, ** = P < 0.01, *** = P < 0.001.

