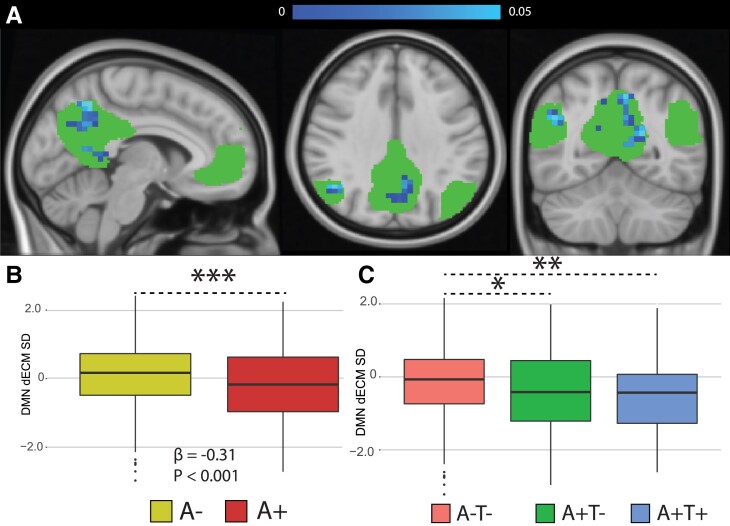
Figure 5.
Dynamic functional connectivity eigenvector centrality in the default mode network. (A) Statistical significant differences showing lower dynamics in amyloid positive participants (in blue). Bottom-row: Differences in DMN dynamic EC standard deviation between amyloid groups (B) and AT groups (C) were investigated with linear models. Abbreviations: dECM = dynamic eigenvector centrality; SD = standard deviation; A- = Amyloid negative; A-T- = Amyloid negative Tau negative; A+T- = Amyloid positive Tau negative; A+T+ = Amyloid positive Tau positive. * = P < 0.05, ** = P < 0.01, *** = P < 0.001.

