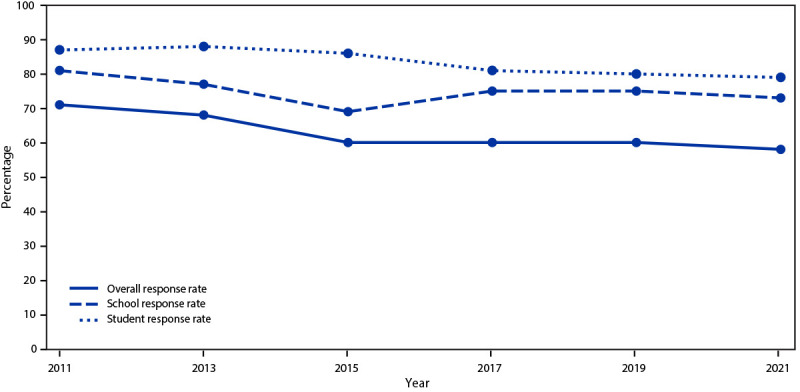
FIGURE 3.

Overall, school, and student response rates for the Youth Risk Behavior Survey, by year of survey — United States, 2011–2021

Overall, school, and student response rates for the Youth Risk Behavior Survey, by year of survey — United States, 2011–2021