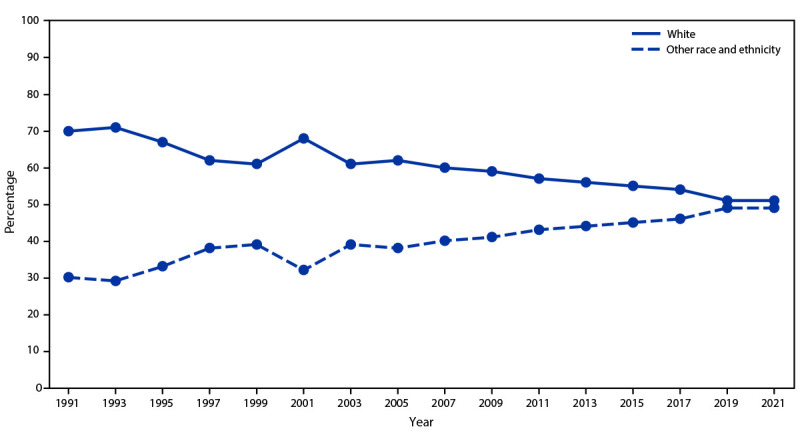
FIGURE 4.

Percentage of students identifying as White or other race and ethnicity,* by year of survey — Youth Risk Behavior Survey, 1991–2021

Percentage of students identifying as White or other race and ethnicity,* by year of survey — Youth Risk Behavior Survey, 1991–2021