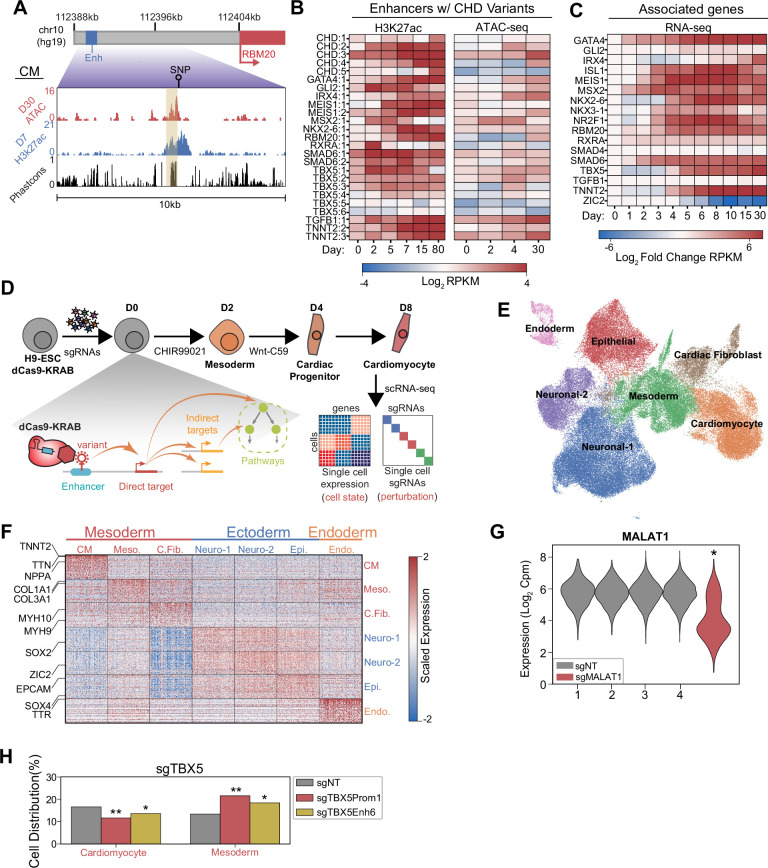
Figure 1. Single-cell screens of congenital heart defect (CHD)-associated enhancers during cardiomyocyte (CM) differentiation.
(A) Genome browser snapshot emphasizing features of a targeted enhancer about 15 kb upstream of the RBM20 gene. Yellow highlights enhancer region. (B) H3K27ac and open chromatin (ATAC-Seq) enrichment for targeted enhancers across multiple time points of CM differentiation (Liu et al., 2017; Tompkins et al., 2016; Zhang et al., 2019). (C) Expression of putative target genes across multiple stages of CM differentiation. Expression defined as fold change over the day 0 expression of a target gene (Tompkins et al., 2016). (D) Schematic of single-cell CRISPRi screen. H9-dCas9-KRAB cells are infected with a lentiviral sgRNA library and differentiated over 8 days into CMs followed by scRNA-seq. Individual cells are linked to sgRNA perturbations and changes in transcriptional cell state. (E) UMAP visualization of H9-derived cells after 8 days of differentiation. Seven Louvain clusters indicated. (F) Expression of the top 100 cluster defining genes for each Louvain cluster cell type. (G) MALAT1 expression in control (non-targeting) and sgMALAT1 cells (*p<0.05 by Mann-Whitney U). (H) Distribution of cells receiving sgNT, sgTBX5 PROM1, sgTBX5 ENH6 that differentiate into CM and mesoderm states (*p<0.05 and **p<0.001 by hypergeometric test).


