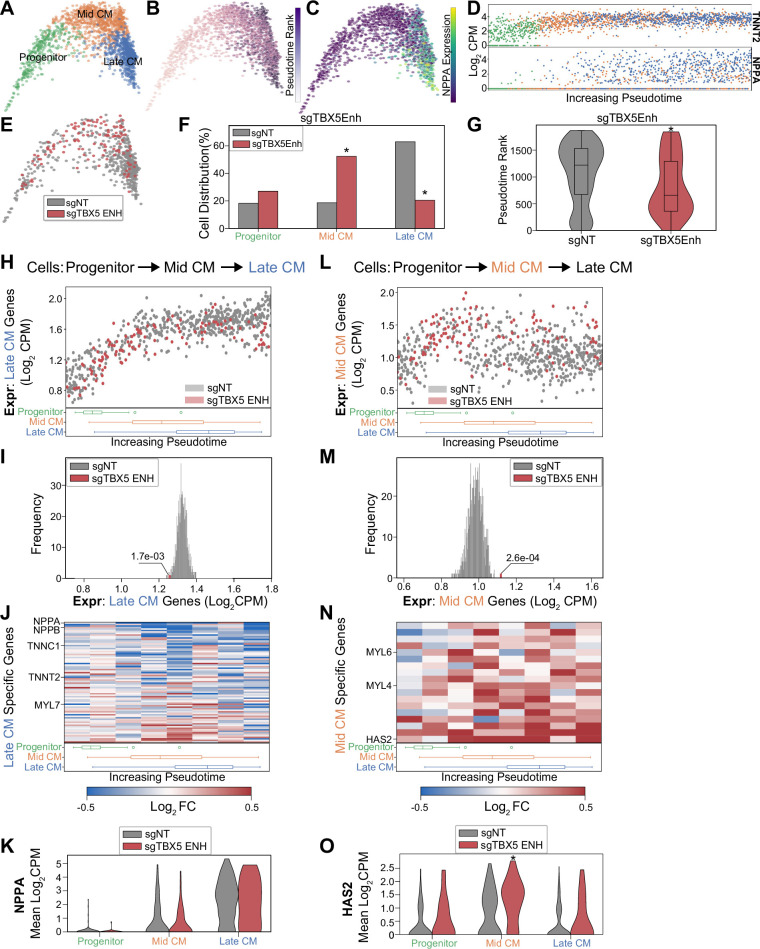
Figure 4. TBX5 enhancer repression alters cardiomyocyte (CM) molecular signatures.
PHATE visualization of CMs in the focused screen with three Louvain clusters. (B) Feature plot of pseudotime ranking of cells across PHATE trajectory. (C) Feature plot of NPPA expression. (D) Single-cell expression of TNNT2 (top) and NPPA (bottom) across pseudotime ordered CMs. (E) Feature plots of cells receiving sgRNAs targeting TBX5 enhancers or non-targeting non-genome targeting (NT) control. (F) Distribution of states for cells receiving sgRNAs targeting TBX5 enhancers or non-targeting NT control (*p<0.05 by hypergeometric test). (G) Distribution of pseudotime rank for cells receiving sgRNAs targeting TBX5 enhancers and NCs (*p<0.05 by Mann-Whitney U) (nNT = 558 cells, nTBX5 Enh = 122 cells). (H) (Top) We defined late-CM genes as those more expressed in late-CM cells. Shown is the average expression of late-CM genes in cells across pseudotime. Cells receiving sgRNAs targeting TBX5 enhancers (red) or non-targeting NT control (gray). (Bottom) Boxplots of CM subpopulation pseudotime ranks across pseudotime. (I) Average expression of late-CM genes across cells receiving sgRNAs targeting TBX5 enhancers (red) and 1000 random samplings of non-targeting control (sgNT) late-CM cells (gray) (*p<0.05 by Z-test). (J) (Top) For late-CM genes, shown is the relative expression in cells receiving sgRNAs targeting TBX5 enhancers compared with non-targeting NT control, across pseudotime. (Bottom) Boxplots of CM subpopulation pseudotime ranks across pseudotime. (K) NPPA expression in cells receiving sgRNAs targeting TBX5 enhancers and NC. (L) (Top) We defined mid-CM genes as those more expressed in mid-CM cells. Shown is the average expression of mid-CM genes in cells across pseudotime. Cells receiving sgRNAs targeting TBX5 enhancers (red) or non-targeting NT control (gray). (Bottom) Boxplots of CM subpopulation pseudotime ranks across pseudotime. (M) Averaged expression of mid-CM genes across cells receiving sgRNAs targeting TBX5 enhancers (red) and 1000 random samplings of non-targeting control (sgNT) late-CM cells (gray) (*p<0.05 by Z-test). (N) (Top) For mid-CM genes, shown is the relative expression in cells receiving sgRNAs targeting TBX5 enhancers compared with non-targeting NT control, across pseudotime. (Bottom) Boxplots of CM subpopulation pseudotime ranks across pseudotime. (O) HAS2 expression in cells receiving sgRNAs targeting TBX5 enhancers and non-targeting NT control.


