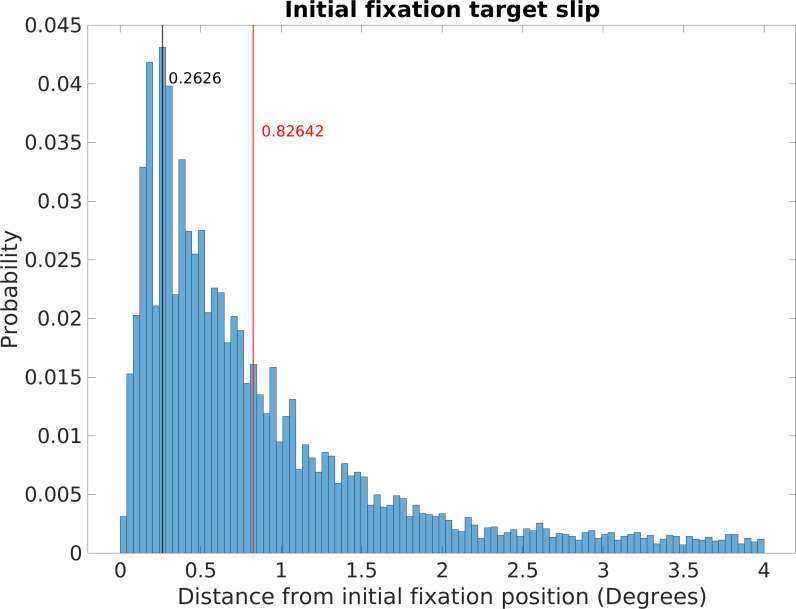
Figure 10. Retinal image slippage.
Normalized relative frequency histogram of the deviation from the location of the initial fixation over the course of a fixation. Initial fixation location is computed and tracked over the course of each fixation, and compared to current fixation for duration of each fixation. Median deviation value is calculated for each fixation. The histogram captures the extent of variability of initially fixated locations relative to the measured location of the fovea over the course of fixations, with most initially fixated locations never deviating more than 2 deg of visual angle during a fixation.

