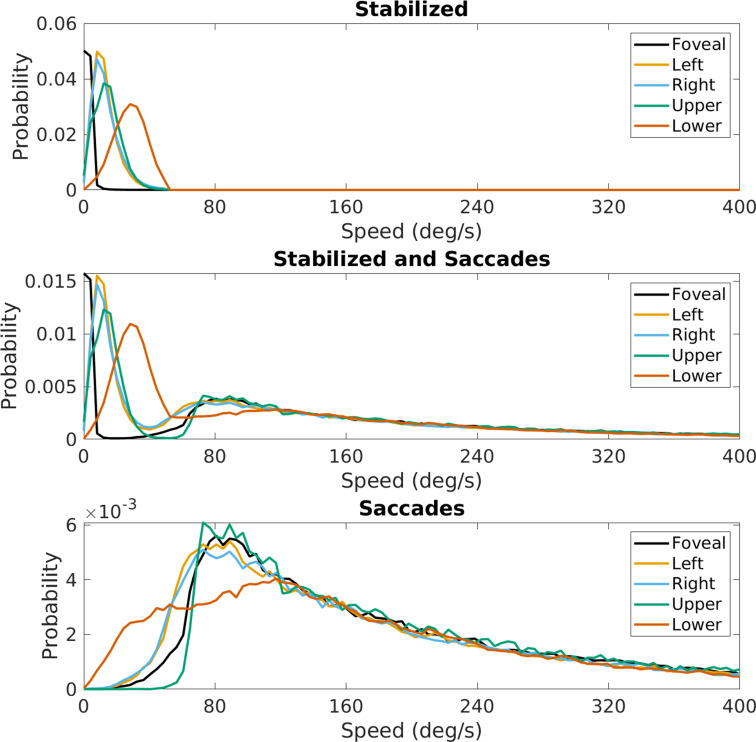
Figure 13. Effect of saccades on speed distributions.
Speed distributions at the five locations in the visual field shown in Figure 4. The top panel is replotted from Figure 4, the middle panel shows these distributions with the saccades added, and the bottom panel shows the contribution from the saccades alone.

