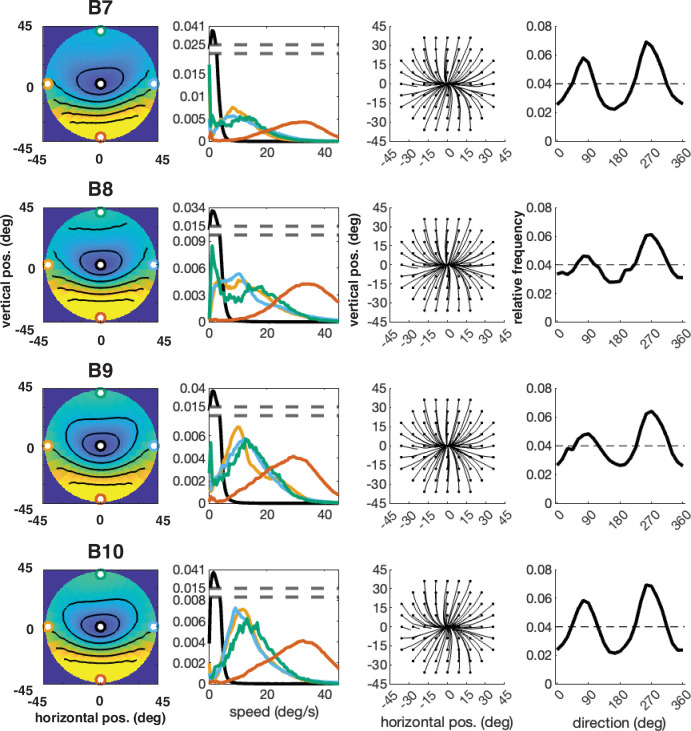
Figure 16. Individual participant data – compare to Figure 4 (five participants: B6–B10).
Column 1: average speed of retinal motion signals as a function of retinal position. Speed is color mapped (blue = slow, red = fast). The average is computed across all subjects and terrain types. Speed is computed in degrees of visual angle per second. Column 2: speed distributions at five points in the visual field (the fovea and four cardinal locations). Column 3: average retinal flow pattern. Column 4 Histogram of the average retinal motion directions (in Column 3) as a function of polar angle. Note: B6’s data is absent because the angle of head camera during data collection precluded proper estimates of retinal flow across the visual field and resulted in poor terrain reconstruction.

