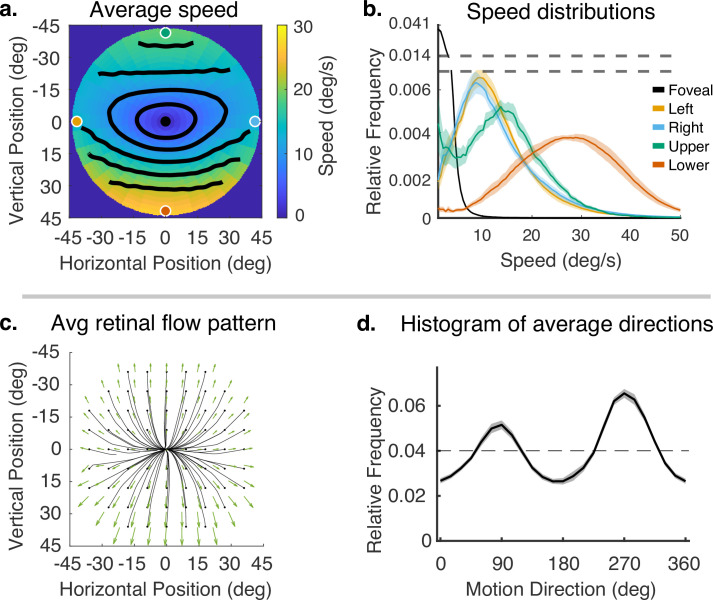
Figure 4. Speed and direction of retinal motion signals as a function of retinal position.
(a) Average speed of retinal motion signals as a function of retinal position. Speed is color mapped (blue = slow, red = fast). The average is computed across all subjects and terrain types. Speed is computed in degrees of visual angle per second. (b) Speed distributions at five points in the visual field at the fovea and four cardinal locations. The modal speed increases in all four cardinal locations, though more prominently in the upper/lower visual fields. Speed variability also increases in the periphery in comparable ways. (c) Average retinal flow pattern as a function of retinal position. The panel shows the integral curves of the flow field (black) and retinal flow vectors (green). Direction is indicated by the angle of the streamline drawn at particular location. Vector direction corresponds to the direction in a 2D projection of visual space, where eccentricity from the direction of gaze in degrees is mapped linearly to distance in polar coordinates in the 2D projection plane. (d) Histogram of the average retinal motion directions (in c) as a function of polar angle. Error bars in (b) and (d) are ±1 SEM over 9 subjects.

