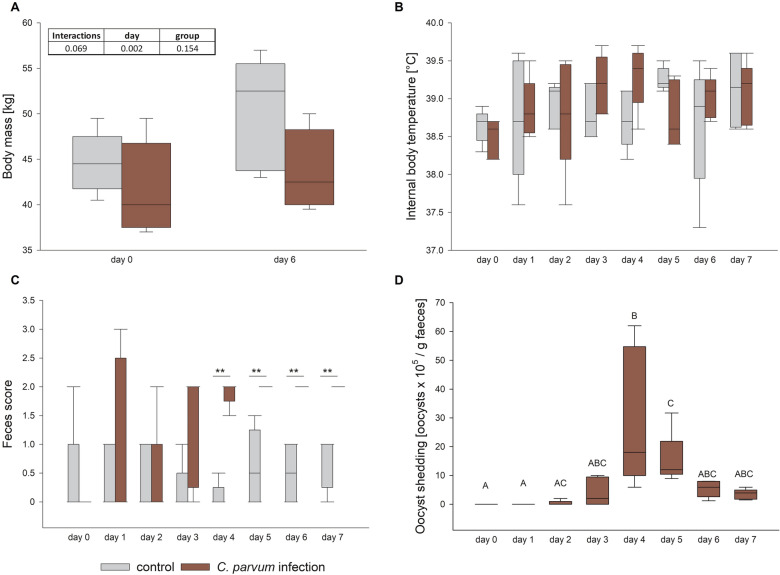
Figure 1.
Body weight (A), internal body temperature (B), fecal consistency (C) and oocyst shedding (D) in control (gray boxes) and infected calves (red boxes). A The body weight was not different between the groups on day 0 and 6 pi but increased significantly over time. B The internal body temperature was not different between the groups or time points. C Fecal samples were scored from 0 to 3 (0 = normal, 1 = mushy, 2 = liquid, 3 = liquid with blood addition) and compared between the groups on each day, resulting in a significantly higher score in the infected calves from day 4 pi. D Oocyst shedding culminated on day 4 pi. Boxes show median and percentiles plus error bars; N = 5, different letters (A, B, C) indicate significant differences between different time points within the same group, two-way RM ANOVA with post-hoc Holm-Sidak-test (A, B) and RM ANOVA on ranks with post-hoc Tukey test (D), respectively, p < 0.05. Asterisks indicate significant differences between the groups, Mann-Whitney Rank Sum Test, **p < 0.01 (C).

