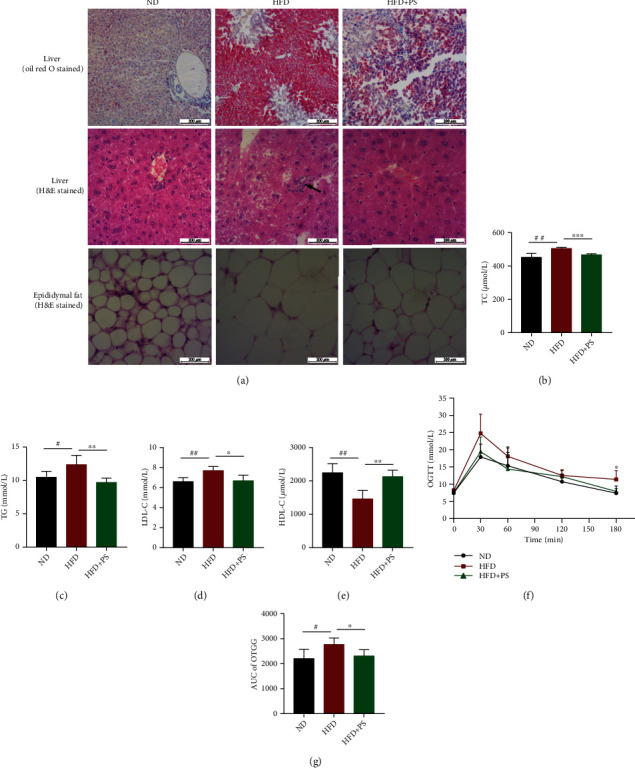
Figure 2.

PS ameliorates disorders of glucose and lipid metabolism in mice. (a) Representative H&E staining of the liver tissue sections from each group. Scale bar: 200 μm. (b–e) Serum TC, TG, LDL-C, and HDL-C concentrations (n = 5 per group). (f, g) Oral glucose tolerance test (OGTT) results of ND, HFD, and HFD+PS mice administrated 2.0 g/kg of glucose after 12 h of fasting and area under the curve (AUC) analysis of three different groups of mice (n = 4 per group). The data were expressed as mean ± SD. #P < 0.05, ##P < 0.01, and ###P < 0.001 vs. ND groups; ∗P < 0.05, ∗∗P < 0.01, and ∗∗∗P < 0.001 vs. HFD groups.
