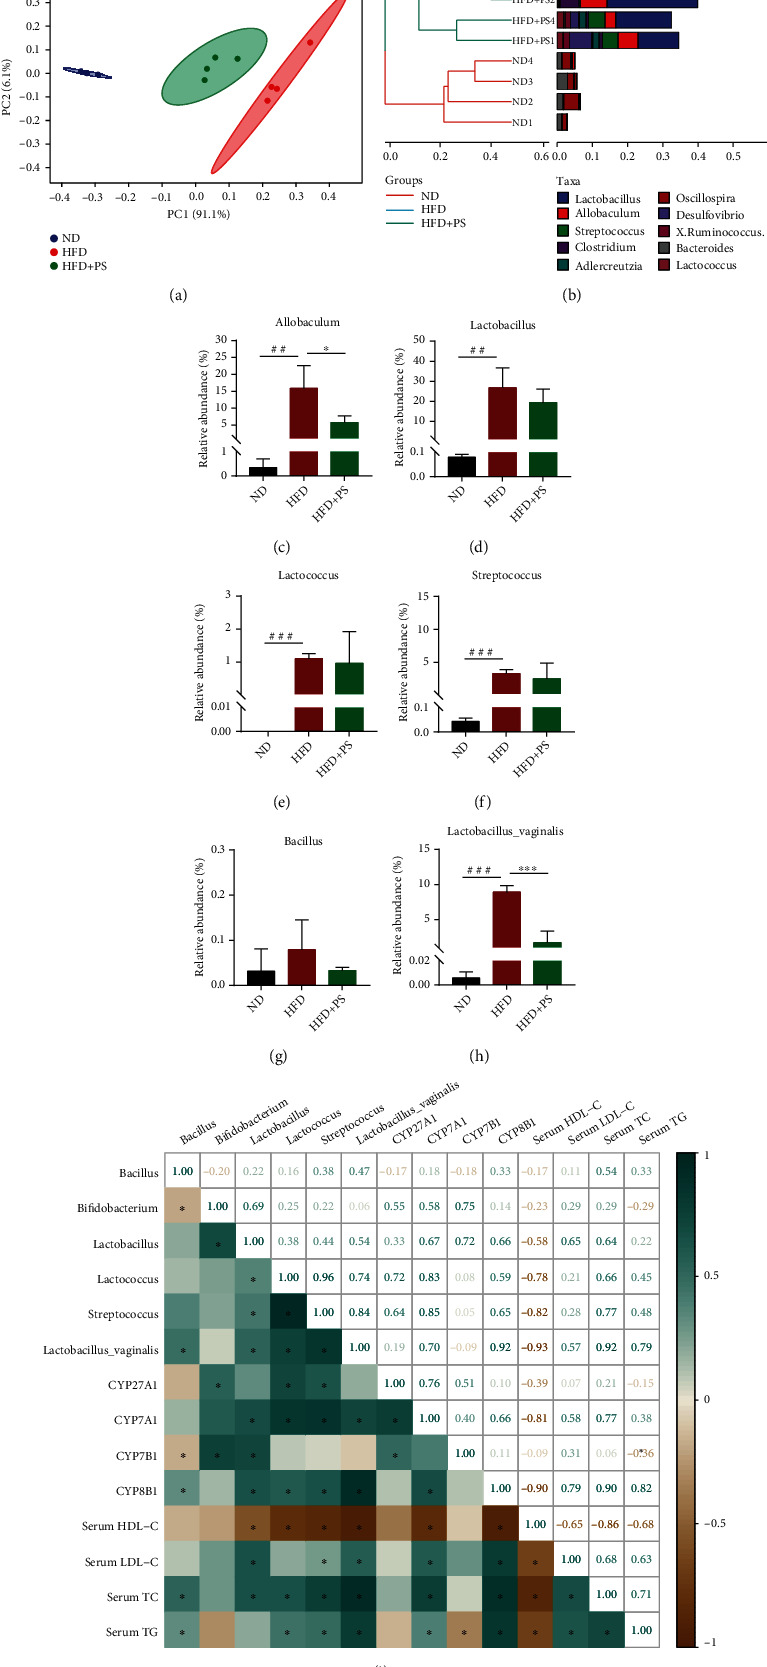
Figure 6.

PS alters the structure of the intestinal microbiota in mice. (a) Principal component analysis (PCA) plot. (b) Hierarchical clustering analysis. (c–g) The relative abundance of gut microbiota at the genus level, including Allobaculum, Lactobacillus, Lactococcus, Streptococcus, and Bacillus (n = 4 per group). (h) The relative abundance of Lactobacillus vaginalis. (i) Pearson's correlation coefficients among gut microbiota, TC, TG, LDL-C, HDL-C, and CYPs. The data were expressed as mean ± SD. ##P < 0.01 and ###P < 0.001 vs. ND groups; ∗P < 0.05 and ∗∗∗P < 0.001 vs. HFD groups.
