. 2022 Apr 12;54(2):156–163. doi: 10.5114/ait.2022.115351
Copyright © Polish Society of Anaesthesiology and Intensive Therapy
This is an Open Access journal, all articles are distributed under the terms of the Creative Commons Attribution-NonCommercial-ShareAlike 4.0 International (CC BY-NC-SA 4.0). License (http://creativecommons.org/licenses/by-nc-sa/4.0/), allowing third parties to copy and redistribute the material in any medium or format and to remix, transform, and build upon the material, provided the original work is properly cited and states its license.
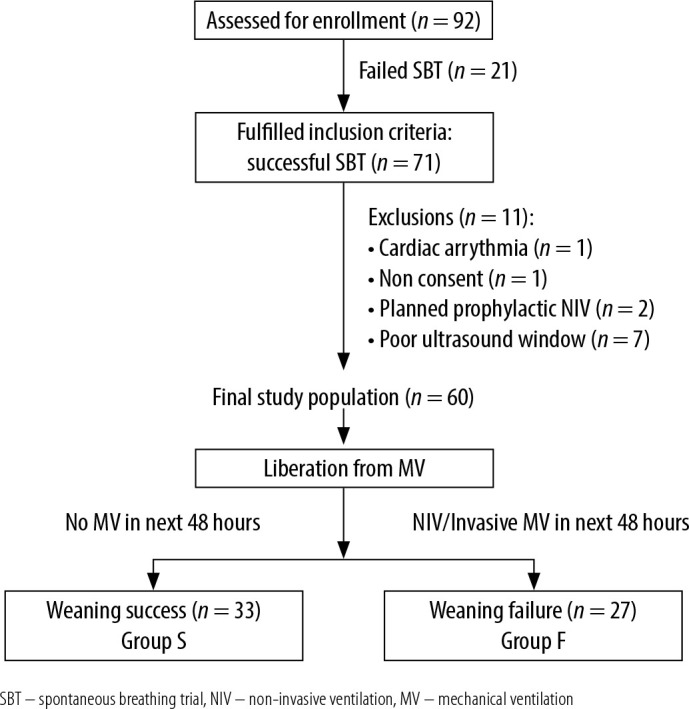
FIGURE 1.

Flowchart depicting the flow of patients through the study
