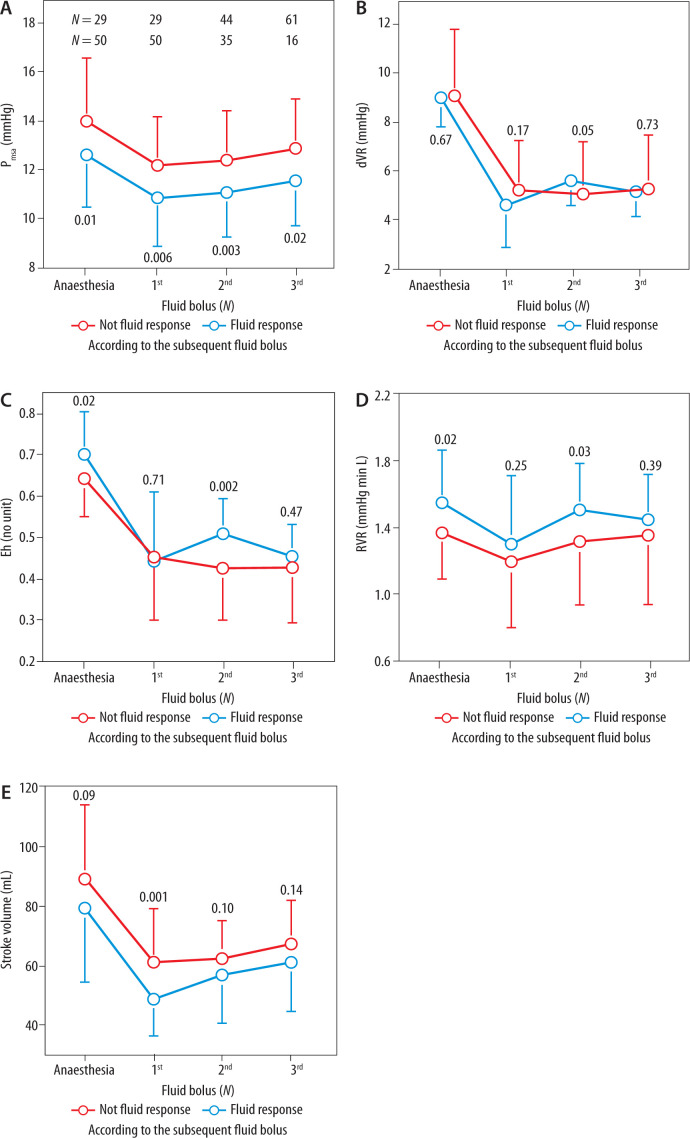
FIGURE 3.
Guyton’s haemodynamic parameters (A–D) and the stroke volume (E) depending on whether patients were nonresponders or responders before anaesthesia was induced and just prior to administration of the 3 subsequent fluid bolus infusions. Data are the mean, and the error bars represent the standard deviation. Statistical comparison was made by one-way ANOVA for each pair of data, and the resulting P-value is shown. The number of included patients changed for each comparison are shown on top of subplot A. The variable number invalidated paired testing

