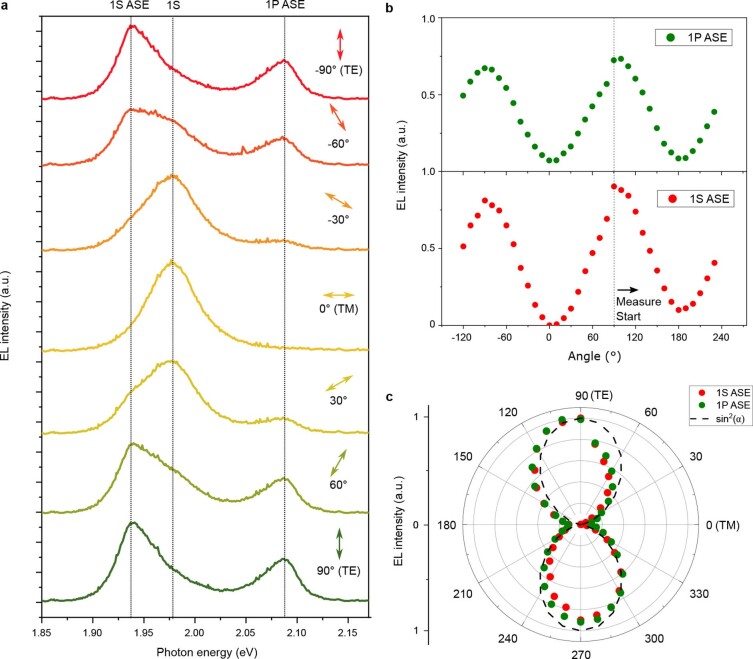
Extended Data Fig. 7. Polarization measurements of edge-emitted EL.
a, Edge-emitted EL spectra of the BRW device operated at about 100 A cm−2 collected through a linear polarizer whose polarization direction is varied from 90° (vertical polarization; TE mode) to 0° (horizontal polarization; TM mode). The dashed black lines at 1.93, 1.98 and 2.08 eV correspond to the maxima of the 1S ASE, 1S spontaneous emission and 1P ASE features, respectively. Polarization-dependent changes in the EL spectral shape indicate that both the 1S and 1P ASE bands are strongly TE polarized. b, The amplitudes of the 1S ASE (red circles) and 1P ASE (green circles) bands as a function of polarization angle (α). The measurement of one data point took around 1 min and it took approximately 36 min to obtain the entire dataset. There was some degree of signal degradation during the measurements, which led, in particular, to a drift of a baseline. c, The same measurements plotted using polar coordinates. The experimental data (symbols; same colours as in b) are in good agreement with the theoretical sin2α dependence expected for TE-polarized light (dashed black line). a.u., arbitrary units.

