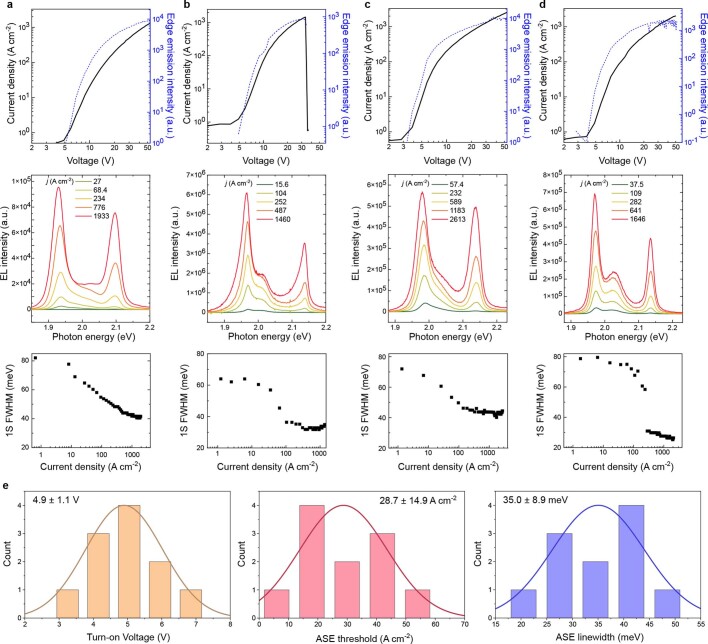
Extended Data Fig. 10. Reproducibility of characteristics of BRW ASE devices.
a–d, Characteristics of four devices from four different chips (each chip contains eight devices). The data are organized into four columns, one column per device. The top row shows the j–V curves (black lines) and the V-dependent edge emission intensity (right axis, blue lines). The middle row shows EL spectra that feature prominent 1S and 1P ASE bands. The bottom row shows the dependence of the 1S bandwidth on j, which exhibits ‘line narrowing’ typical of the transition to the ASE regime. There is excellent consistency between all shown datasets. e, The analysis of device-to-device variability of a turn-on voltage (left), a 1S ASE threshold (middle) and a 1S ASE linewidth. The histograms were obtained on the basis of the measurements of 11 devices. The average values of the measured parameters and the standard deviations are indicated in the figure. In the case of the turn-on voltage and the ASE linewidth, the standard deviations are 22% and 25% of the average value, respectively. The larger deviation observed for the ASE threshold (about 52%) can be attributed to high sensitivity of jth,ASE to device-to-device variations in propagation losses and a varied degree of charging of an active QD layer. a.u., arbitrary units.

