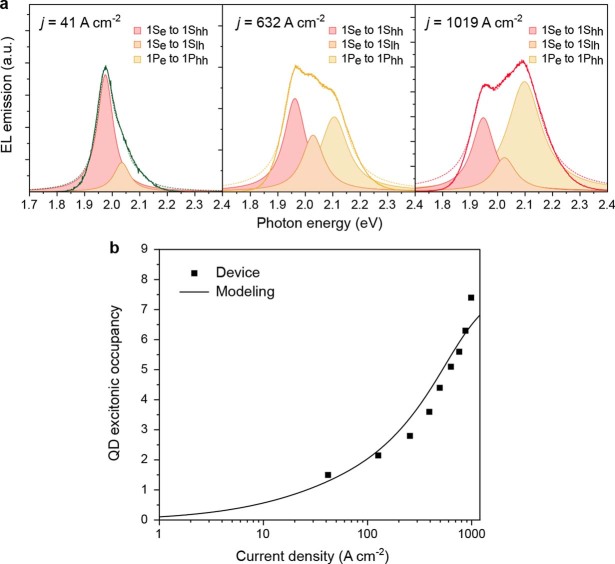
Extended Data Fig. 1. Characterization of the reference electroluminescent device.
a, The EL spectra of the reference device (Fig. 1f) are deconvolved using three Lorentzian bands that correspond to the 1Se–1Shh, 1Se–1Slh and 1Pe–1Phh transitions. This procedure is applied to the EL spectra measured at j = 41 A cm−2 (left), 632 A cm−2 (middle) and 1,019 A cm−2 (right). b, The average QD excitonic occupancy, ⟨N⟩, in the active device volume as a function of current density. Symbols are experimental values of ⟨N⟩ obtained from the measured ratio of the 1P and 1S EL intensities10. The line is calculations conducted using the model of ref. 10. According to this analysis, ⟨N⟩ reaches 7.4 at j = 1,019 A cm−2. This is above the gain thresholds for both the 1S and 1P transitions10,12. a.u., arbitrary units.

