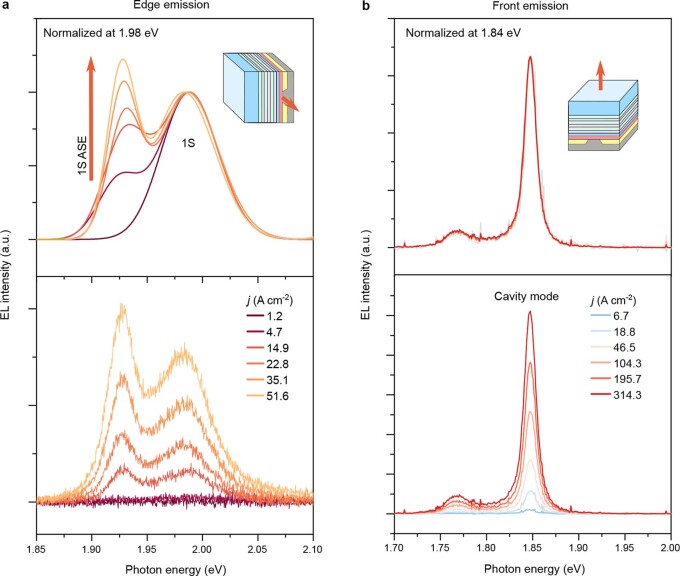
Extended Data Fig. 5. Evolution of edge-emitted and surface-emitted EL spectra with increasing current density.
a, Edge-emitted EL spectra of the BRW device as a function of j. The bottom subpanel shows ‘raw’ (not normalized) experimental spectra. The top subpanel shows the normalized spectra scaled so as to match the amplitude of the 1S spontaneous emission feature (owing to a high noise level below the ASE threshold, we present the measured spectra using two-band Gaussian fits). The normalized spectra clearly show the emergence of a sharp 1S ASE band. b, Similar sets of data for surface-emitted EL of the same device. The EL is dominated by a vertical cavity mode at 1.84 eV. It is red-shifted versus that of the device shown in Extended Data Fig. 2b, because of a larger thickness of the device tested in the present measurements. The feature around 1.77 eV results from light leakage through the DBR (see Supplementary Fig. 4). Unlike edge-emitted EL, the surface-emitted signal shows spectrally uniform growth with increasing j. a.u., arbitrary units.

