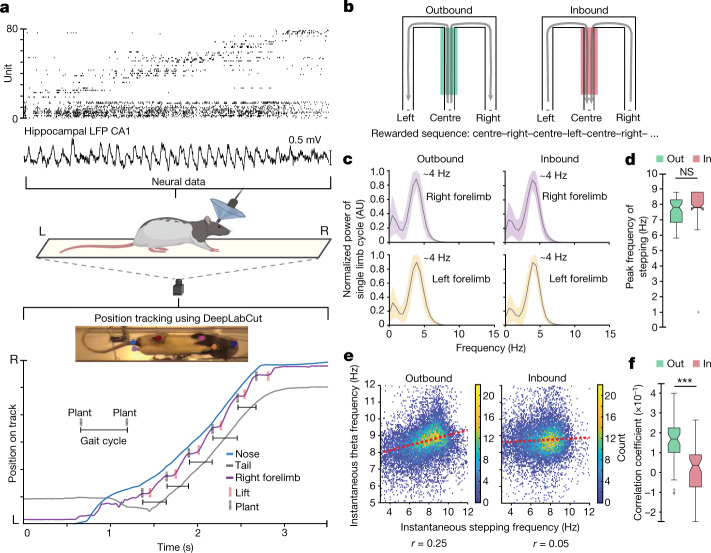
Fig. 1. The structure of locomotor activity and its relationship to the hippocampal theta rhythm.
a, Top, example spike raster from high-density neural recordings of the rat hippocampus (rat 1, n = 77 neurons) during navigation on a transparent track. For position tracking, a high-speed camera captures the bottom view at 125 frames per second. A machine-learning algorithm, DeepLabCut (ref. 65), is trained to track the nose, forelimbs, hindlimbs and base of the tail of the rat. L, left; R, right; LFP, local field potential. Bottom, simultaneously monitored displacement of the nose, tail, and right forelimb. Plant (black dotted vertical lines) and lift (red dotted vertical lines) times of the right-forelimb stepping cycle are labelled. The schematic of the rat, track and camera was created using Biorender. b, Schematic of the w-track task. The behavioural apparatus and rewarded inbound and outbound trajectories are shown with arrows. The centre arm is shaded to denote a region experienced during both inbound and outbound trials and used for quantifications below. c, Power spectral density analysis of the stepping cycle of each forelimb during outbound (left) and inbound (right) trials. Trials for all rats combined. Shaded regions represent s.e.m. AU, arbitrary units. d, Comparison of the peak frequency of forelimb stepping observed when rats traversed the centre portion of the track during outbound (green) and inbound (red) trials (n = 61 epochs in 5 rats, outbound, median: 7.8 Hz, interquartile range (IQR): 6.8–8.3 Hz; inbound, median: 7.8 Hz, IQR: 7.8–8.9 Hz; outbound versus inbound Kruskal–Wallis test: P = 0.11; individual animal P values: P (rat 1), 0.3; P (rat 2), 0.1; P (rat 3), 0.6; P (rat 4), 0.1; P (rat 5), 0.2; NS, not significant). Centre lines show the median; box limits indicate the 25th and 75th percentiles; whiskers extend 1.5 × IQR from the 25th and 75th percentiles; outliers are represented by grey symbols. e, Correlation between instantaneous forelimb stepping frequency and instantaneous hippocampal theta frequency during outbound (left) and inbound (right) runs, presented in binned scatter plots. The colour scale corresponds to the count in each bin. Trials for all rats combined. f, Correlation coefficients between instantaneous forelimb stepping frequency and instantaneous hippocampal theta frequency for outbound and inbound trials across epochs (n = 61 epochs in 5 rats, average difference = 0.14, paired two-sided Wilcoxon signed-rank test: P = 3.3 × 10⁻⁸; individual animal P values: P (rat 1), 0.02; P (rat 2), 0.01; P (rat 3), 2 × 10⁻³; P (rat 4), 0.03; P (rat 5), 8 × 10⁻³; adjusted P values: P (rat 1), 0.02; P (rat 2), 0.02; P (rat 3), 8 × 10⁻³; P (rat 4), 0.03; P (rat 5), 0.02). Centre lines show the median; box limits indicate the 25th and 75th percentiles; whiskers extend 1.5 × IQR from the 25th and 75th percentiles; outliers are represented by grey symbols. ***P < 0.0005).

