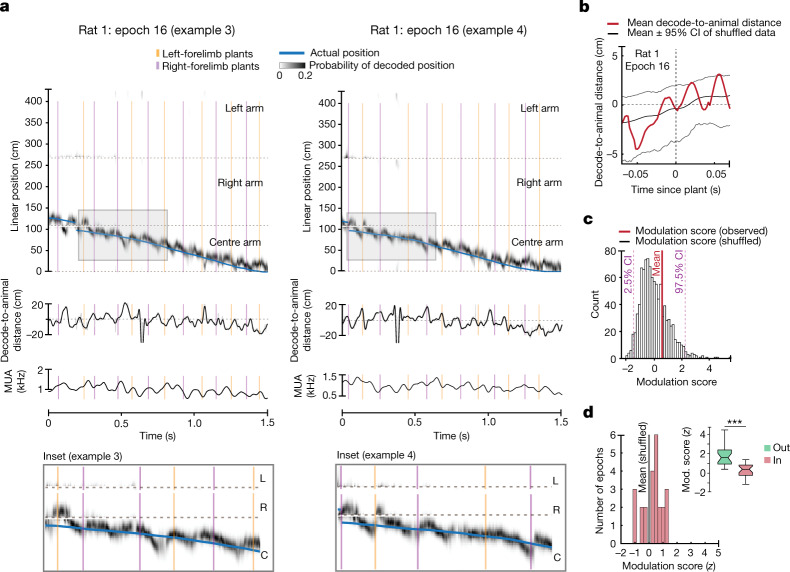
Fig. 3. Engagement between hippocampal neural representations and stepping rhythm is dependent on task phase.
a, Estimation of the represented position on the basis of clusterless decoding (as in Fig. 2) during inbound runs on the centre arm of the w-track. Blue trace represents the linearized position of the rat’s nose. Grey density represents the decoded position of the rat on the basis of spiking. Orange and purple vertical lines represent the plant times of the left and the right forelimb, respectively. Note that the decode-to-animal distance and MUA rhythmically fluctuate during the inbound runs. Shaded box indicates inset enlarged below. C, centre; R, right; L, left. b, Decode-to-animal distance trace triggered by forelimb plant times that precede non-local representations greater than 10 cm ahead of the rat’s current position for the selected region (60–100 cm) (red line; data from rat 1, epoch 16). Grey lines represent the 95% CI of the shuffled distribution. The dotted line at 0 indicates decode-to-animal distance values corresponding to the actual position of the rat’s nose. c, Decode-to-animal distance modulation score of the observed data (vertical line, red) and the histogram of the modulation score for the shuffled distributions (bars, grey). d, Distribution of modulation scores for the observed data in all rats (red bars) and the mean of the modulation score for the shuffled data (grey vertical line, n = 24 epochs in 4 rats, two-sided t-test: P = 0.08; individual animal P values: P (rat 1), 0.8; P (rat 2), 0.4; P (rat 3), 0.3; P (rat 5), 0.01; adjusted P values: P (rat 1), 0.8; P (rat 2), 0.5; P (rat 3), 0.5; P (rat 5), 0.05). Inset, comparison between the decode-to-animal distance modulation score during outbound (green) and inbound (red) runs on the w-track shows a stronger modulation of decode-to-animal distance by forelimb plants during outbound runs on the centre arm (4 rats, 24 epochs, Wilcoxon signed-rank test: P = 4.3 × 10⁻⁵; individual animal P values: P (rat 1), 0.03; P (rat 2), 0.04; P (rat 3), 0.03; P (rat 5), 0.06; adjusted P values: P (rat 1), 0.05; P (rat 2), 0.05; P (rat 3), 0.05; P (rat 5), 0.06; ***P < 0.0005). Centre lines show the median; box limits indicate the 25th and 75th percentiles; whiskers extend 1.5 × IQR from the 25th and 75th percentiles.

