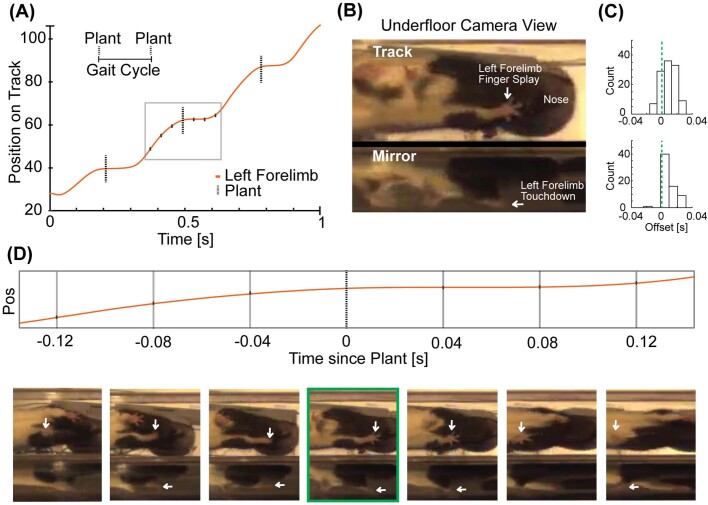
Extended Data Fig. 1. Validation of the locomotor tracking and detecting forelimb plant times.
a, Example displacement of a reference forelimb and detected plant times (dashed vertical lines) highlighting one complete gait cycle as a rat ran on a transparent track. b, Bottom view (track) and a 45-degree mirror view (mirror) are marked to highlight the two views used for manually detecting ‘fingersplay’ and ‘touchdown’ times (see Methods). c, Histogram of plant-fingersplay and plant-touchdown offsets shows close correspondence of these two (plant – handsplay median offset/IQR=0.008s, 0.016s, n = 114 plants; plant – touchdown median offset/IQR=0.008s, 0.008s, number of plants = 66). We note here that the human estimates involve somewhat subjective judgements and are not obviously more accurate than those of the algorithm. d, Screenshots of three frames on either side of the algorithm detected plant times (highlighted in green box) show the limb placement before and after the plant time.

