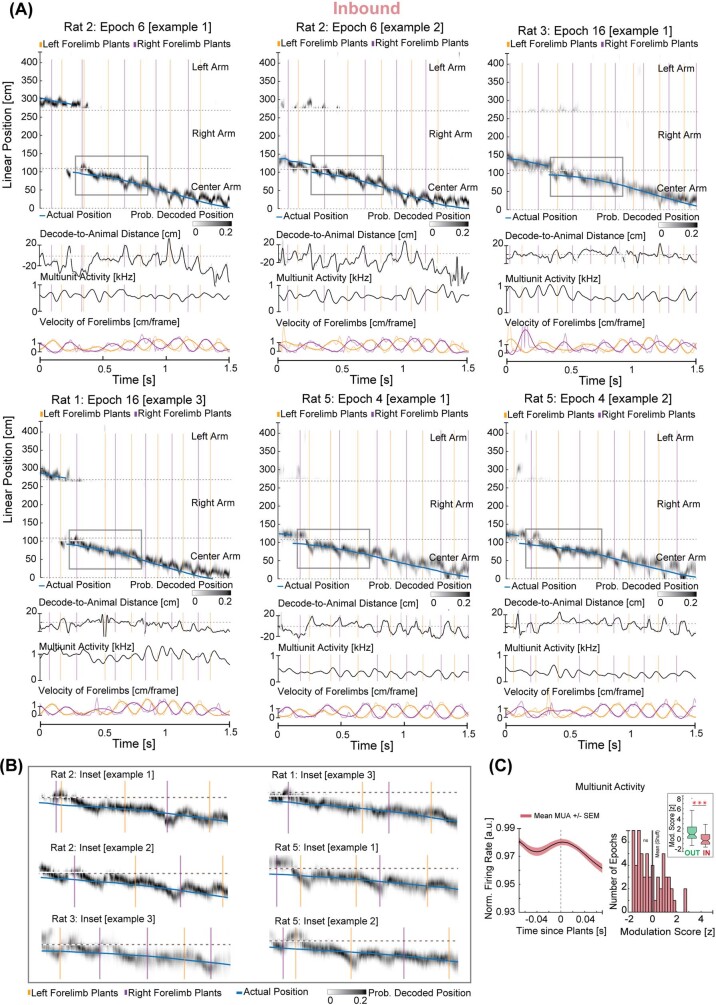
Extended Data Fig. 5. Examples of hippocampal spatial representations and forelimbs during inbound trials.
a, Individual examples as in Fig. 2 from rat 2, rat 3 and rat 5. Blue trace represents the linearized position of the rat’s nose. Grey density represents the decoded position of the rat based on spiking. Orange and purple vertical lines represent the plant times of the left and right forelimb, respectively. Note that the decode-to-animal distance, MUA, and stepping rhythmically fluctuate during the inbound runs—shaded regions in zoomed insets below. b, Insets are shaded areas in a enlarged to highlight individual examples of hippocampal representations and forelimb plants during inbound trials on the centre arm. Note, the lack of coordination between forelimb plants and hippocampal representation during inbound trials. On these trials, forelimb plants could occur when hippocampal decode represents positions that are ahead, concurrent, or behind the actual location of the rat. c, Left, forelimb-plant-triggered MUA (mean +/− SEM) shows low modulation during inbound trials. Right, correspondingly, the distribution of the MUA modulation score for the observed data in all rats (red, bars) is significantly different from the mean of the modulation score for the shuffled data (black, vertical line, 5 rats, 61 epochs, two-sided t-test: p = 0.37, individual animal p values: p (rat 1): 0.6, p (rat 2): 0.1, p (rat 3): 0.3, p (rat 4): 0.8, p (rat 5): 0.2). Inset: comparison of the MUA modulation score during the outbound (green) and inbound (red) runs on the centre arm of the w-track shows a more robust modulation during the outbound portions (n = 61 epochs in 5 rats, paired two-sided Wilcoxon signed-rank test: p = 1.7 x 10⁻⁷, individual animal p values: p (rat 1): 2 x 10⁻³, p (rat 2): 9 x 10⁻³, p (rat 3): 0.1, p (rat 4): 5 x 10⁻³, p (rat 5): 0.03; adjusted p values: p (rat 1): 0.01, p (rat 2): 0.01, p (rat 3): 0.1, p (rat 4): 0.01, p (rat 5): 0.04). ***p < 0.0005. Centre lines show the medians; box limits indicate the 25th and 75th percentile; whiskers extend 1.5 times the interquartile range from the 25th and 75th percentiles; outliers are represented by grey symbols.

