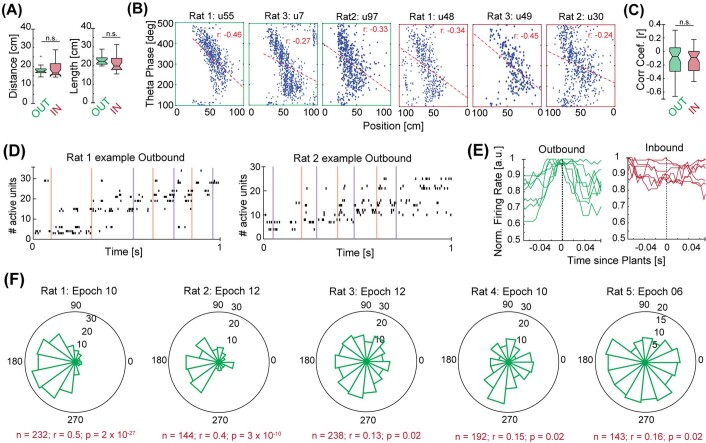
Extended Data Fig. 6. Theta sequences and theta-phase precession are prevalent during both outbound and inbound task phases.
a, Left, distribution of peaks (median per epoch) of the decode-to-animal distance trace on outbound and inbound task phases on the centre arm were not statistically different (n = 24 epochs in 4 rats; outbound median: 17 cm, inbound median: 16 cm inbound; Kruskal–Wallis test: p = 0.39; individual animal p values: p (rat 1): 0.7, p (rat 2): 0.5, p (rat 3): 0.6, p (rat 5): 0.8). Right, in a complementary approach, we parsed the decode-to-animal-distance trace by theta troughs and compared their length (median per epoch) during outbound and inbound portions on the track. Here again, we did not find a consistent difference between inbound and outbound task phases on the centre arm (median length outbound: 22 cm, median length inbound 19 cm, p: 0.08; individual animal p values: p (rat 1): 3 x 10⁻³; p (rat 2): 0.9, p (rat 3): 0.9, p (rat 5): 0.8). b, Example phase-precession plots of three putative pyramidal cells during the outbound (green outer boxes) and inbound (red outer boxes) task phases on the centre arm of the track. Correlation coefficients (r, red text). c, Box plots showing the distribution of correlation coefficients computed for each active putative pyramidal cell in 3 epochs across each of 3 rats (Kruskal–Wallis test p = 0.42, individual animal p values: p (rat 1): 0.8, p (rat 2): 0.3, p (rat 3): 0.4; number of cells outbound: 57; number of cells inbound: 46). Centre lines show the medians; box limits indicate the 25th and 75th percentile; whiskers extend 1.5 times the interquartile range from the 25th and 75th percentiles. d, Examples of spike rasters of active putative pyramidal cells during outbound runs starting on the centre arm of the w-track. Cells are ordered by the mean of spike times on the outbound runs on the track. The plots illustrate that theta sequences can be observed in the spiking activity of pyramidal cells even when putative interneurons are excluded. Coloured vertical lines are plant times of the right (purple) and left (orange) forelimbs. e, Examples of forelimb-plant-triggered activity of putative pyramidal cells (each line corresponds to one cell, n = 6 examples from Rat 1 epoch 16) active during outbound and inbound task phases on the centre arm of the track, respectively. Left, cells active during outbound runs (green). Right, cells active during inbound runs (red). Note the modulation of spiking activity by steps is also observed at the level of individual pyramidal neurons. These results are complementary to Extended Data Fig. 4c and Extended Data Fig. 5c. f, Examples of circular histograms showing the prominent phase relationship between forelimb plants and hippocampal theta oscillations. Bin size: 24 degrees.

