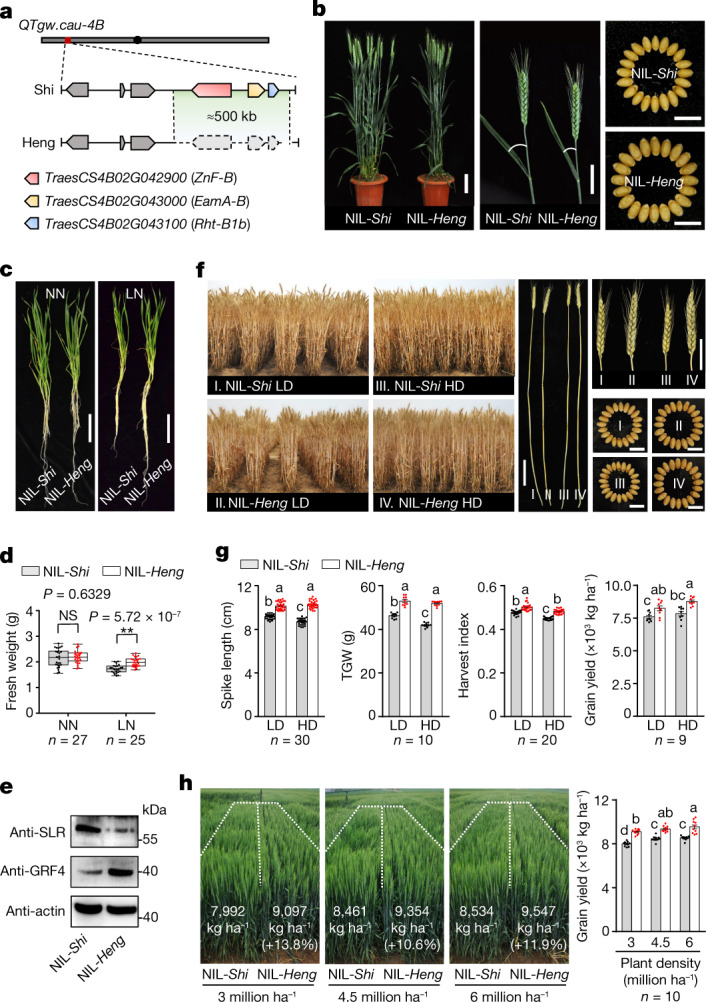
Fig. 1. The r-e-z haploblock deletion improves green revolution plant architecture and grain yield in wheat.

a, Schematic representation of chromosome 4B to show the locations (red bar) of QTgw.cau-4B and the r-e-z haploblock deletion in Shi and Heng. The r-e-z haploblock deleted in Heng is outlined with dashed lines. b, Comparison of plant height, spikes and grain sizes between NIL-Shi and NIL-Heng. c,d, Seedling plant growth performance of the two NILs under normal nitrogen (NN; 2.5 mM KNO3) and low-nitrogen (LN; 0.5 mM KNO3) conditions. The horizontal bars of the boxes represent minima, 25th percentiles, medians, 75th percentiles and maxima (**P < 0.01; NS, not significant; two-tailed Student’s t-test). e, Comparison of DELLA and GRF4 protein content between two NILs. Actin served as a loading control. The experiment was repeated independently three times with similar results. f,g, Comparison of whole plants, spikes and grains between the two NILs grown under low density (LD) with 0.3-m row space and high density (HD) with 0.15-m row space. h, Comparison of plant phenotypes and final yields between the NILs planted at three planting densities in a standard field. Left panel shows field plots of two NILs under three different planting densities. The field plots are outlined by dashed lines; right panel shows the grain yields of two NILs under three planting densities. In g,h, Different letters indicate significant differences (P < 0.05, one-way analysis of variance (ANOVA), Tukey’s honestly significant difference (HSD) test; data are mean ± s.e.m.). In d,g,h, n represents numbers of biologically independent samples. Scale bars (b,c,f), 10 cm for plants, 5 cm for spikes and 1 cm for grains.
