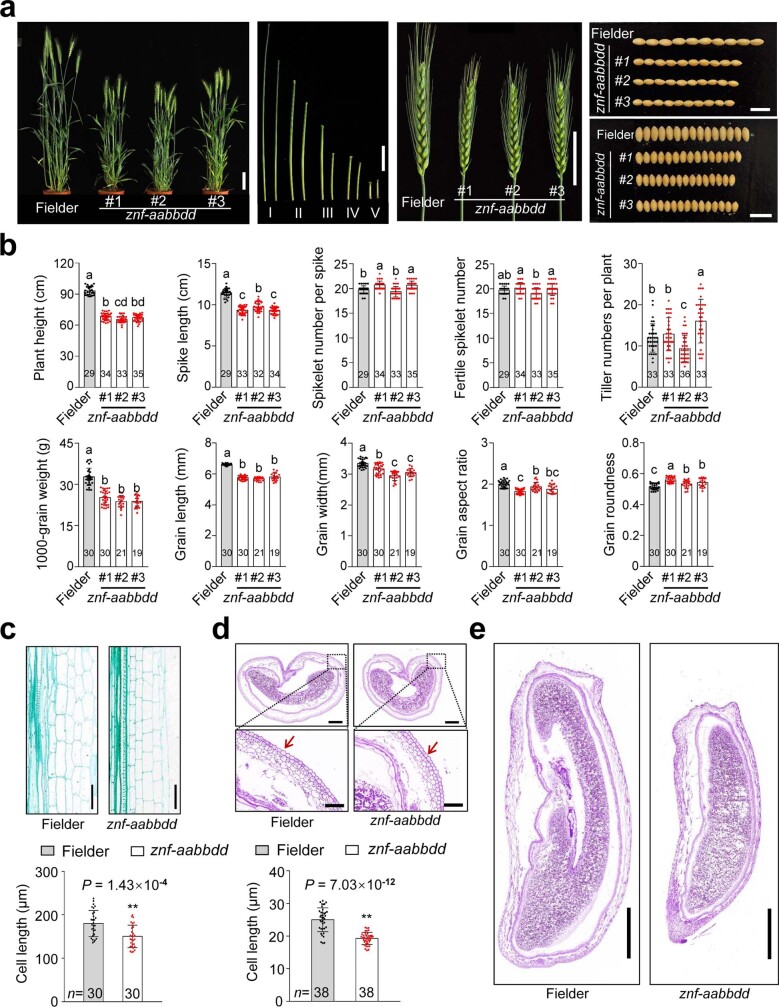
Extended Data Fig. 7. Comparison of phenotypic traits between znf-aabbdd triple mutants and Fielder.
a, Pictures of whole plants, internodes, spikes and grain traits of Fielder and three independent znf-aabbdd mutant lines (#1, #2, and #3). Scale bars are 10 cm for whole plant, 5 cm for stem and spike, and 1 cm for grain. b, Statistical comparison of the phenotypic traits between Fielder and znf-aabbdd mutants. Different letters indicate significant differences (P < 0.05, one-way ANOVA, Tukey’s HSD test; for P values, see Source Data). c, Scanning micrographs of the longitudinal section of fully elongated uppermost internodes of Fielder and a znf-aabbdd mutant at anthesis stage. Scale bars are 200 μm. n = numbers of parenchymatic cells. d,e, Pericarp cell lengths from scanning micrographs of the cross section (d) and the longitudinal section (e) of the developing grains of Fielder and a znf-aabbdd mutant collected at 10 days after pollination (n = numbers of pericarp cells). P values in c,d were calculated by a two-tailed Student’s t-test (** P < 0.01). Scale bars in d are 500 μm for the upper panels, 100 μm for the lower panels; scale bars in e are 1 mm. Data in b,c,d are mean ± s.d.

