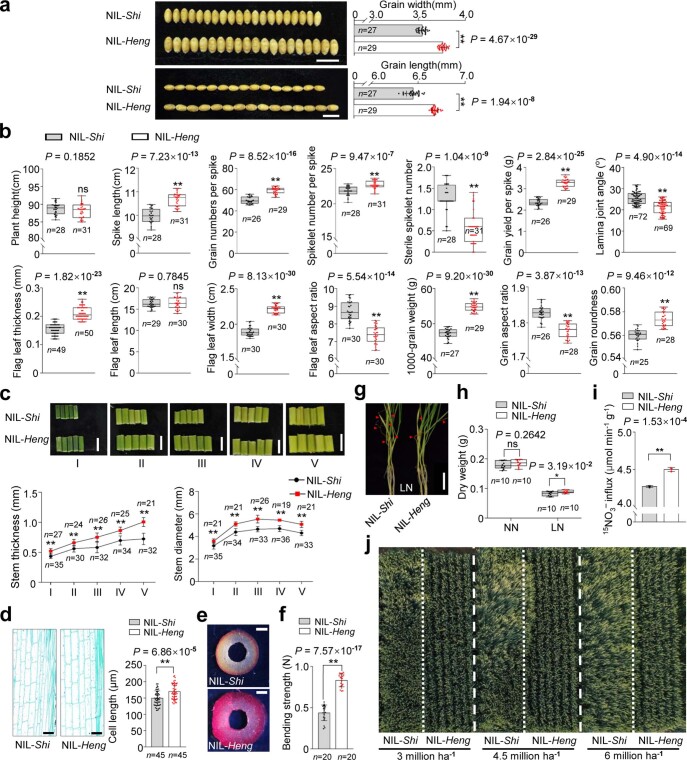
Extended Data Fig. 2. NIL-Heng with deleted r-e-z haploblock carries many favorable agronomic traits.
a, Comparison of the grain sizes (length and width) between the near isogenic lines NIL-Shi and NIL-Heng. Scale bars = 1 cm. b, Comparison of spikelet number per spike, sterile spikelet number, grain yield per spike, grain roundness, flag leaf thickness, flag leaf length, flag leaf width and flag leaf aspect ratio between the NILs. c, Stem sections from different internodes of the two NILs. I, II, III, IV and V represent the 1st to 5th internodes from top to bottom, respectively. Quantitative analyses of stem thickness and stem diameter were separately performed using different internodes collected from independent wheat plants (For P values, see Source Data). Scale bars = 1 cm. d, Comparison of the length of parenchymatic cells from longitudinal sections of the fully elongated uppermost internodes between NIL-Shi and NIL-Heng at the anthesis stage (n = numbers of parenchymatic cells). Scale bars, 100 μm. e, Phloroglucinol staining of the culms from the 1st internodes of NIL-Shi and NIL-Heng plants at heading stage showing the culm thickness. The experiment was repeated independently three times with similar results. Scale bars, 100 μm. f, Comparison of the bending strength of the 4th internodes at heading stage between NIL-Shi and NIL-Heng plants. g, Phenotypes of NIL-Shi and NIL-Heng seedlings grown under the low nitrogen (LN, 0.5 mM KNO3) condition. Scale bar, 10 cm. Red triangles point to yellow leaves. h, Comparison of dry weight between NIL-Shi and NIL-Heng seedlings grown under low nitrogen (LN) and normal nitrogen (NN) conditions, respectively. i, 15N uptake analysis of NIL-Shi and NIL-Heng seedlings (n = 3 biologically independent samples). j, Improved lodging resistance of NIL-Heng compared to that of NIL-Shi planted in standard field plots. In a,b,c,f,h,n = numbers of biologically independent samples. In b,h, the horizontal bars of boxes represent minima, 25th percentiles, medians, 75th percentiles and maxima. Data in a,c,f,d are mean ± s.d. P values were calculated by a two-tailed Student’s t-test (** P < 0.01; * P < 0.05; ns, no significant difference).

