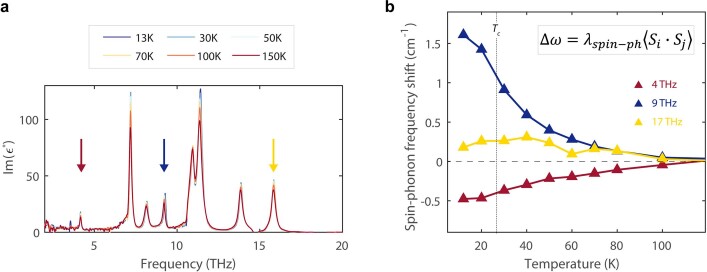
Extended Data Fig. 10. Equilibrium infrared spectroscopy and spin-phonon coupling in YTiO3.
(a) Pseudo-dielectric function for the b-axis of YTiO3 plotted at several different temperatures. Arrows indicate the three modes excited in our experiment. (b) Frequency shifts for the 4, 9, and 17 THz modes as a function of temperature with the anharmonic background subtracted off. The additional shifts are related to spin-phonon coupling, and the anomalous behavior at high temperatures indicates the presence of local spin correlations in YTiO3 well above Tc.

