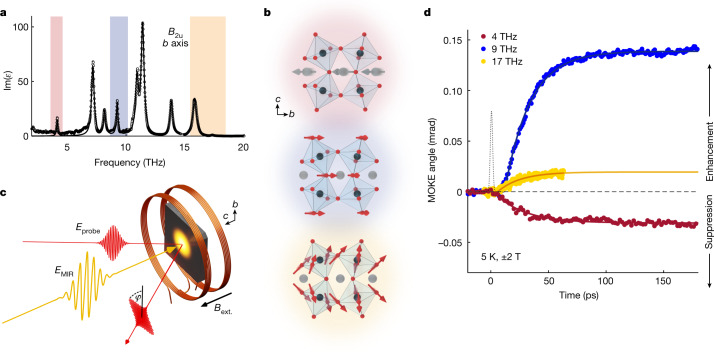
Fig. 2. Phonon-selective control of ferromagnetism in YTiO3.
a, Infrared optical spectrum of b-axis vibrational modes (black). The three phonons pumped in this experiment are shaded in red (4 THz), blue (9 THz) and yellow (17 THz). b, The eigen-displacements corresponding to the pumped vibrational modes in a: the low-frequency mode primarily involves antipolar motions of the Y ions, whereas the two higher-frequency modes mainly consist of displacements of the apical and equatorial oxygens, respectively, within the TiO6 octahedral cage. c, Depiction of the experimental set-up for the time-resolved MOKE measurements. EMIR, terahertz/mid-infrared pump; Eprobe, 800 nm probe; Bext., external magnetic field. d, Pump-induced changes of the MOKE angle () for the three different phonon excitations. The black dotted line shows the pump pulse envelope.

