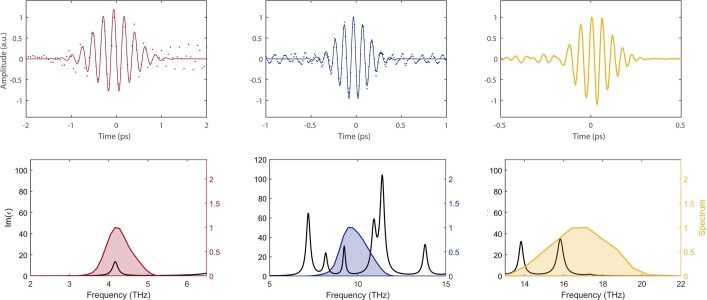
Extended Data Fig. 2. Characterization of the THz excitation pulses.
Representative electro-optic sampling traces (top) and associated spectra (bottom) for the three different THz excitation pulses used in the experiment. The pulse durations are approximately 360 fs at 4 THz (left), 205 fs at 9 THz (center), and 160 fs at 17 THz (right). Solid lines are Gaussian pulse fits used to extract nominal pulse durations. Spectra shown in the bottom panels are obtained from fast Fourier transformation of the raw time-domain data.

