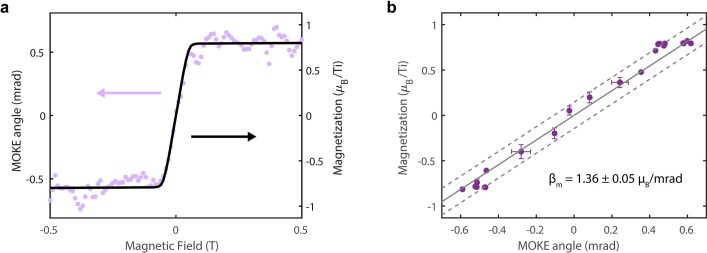
Extended Data Fig. 4. Determining the magneto-optical coefficient from static MOKE measurements.
(a) MOKE angle as a function of magnetic field in the absence of a pump (purple dots, left axis) together with the equilibrium magnetization from VSM (black line, right axis), both measured at 10 K. (b) Correlation plot of the MOKE angle vs. magnetization, showing a linear dependence over the measured range. Binned data from (a) are shown as purple dots. The solid and dashed lines represent the linear fit and the 1σ prediction bounds.

