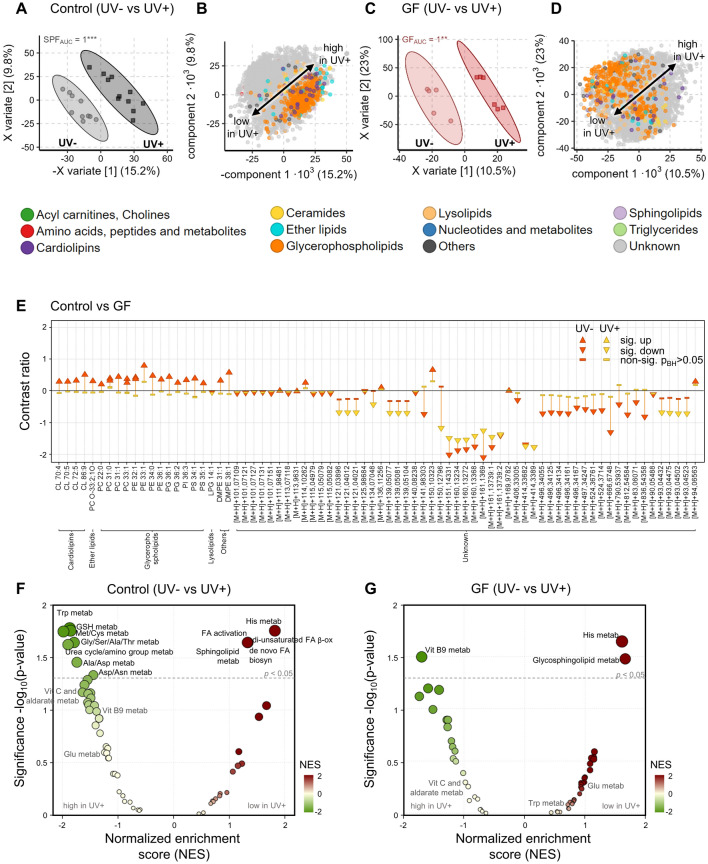
Figure 2.
UVB exposure reduces intra-cutaneous metabolic differences induced by presence/absence of the microbiome. (A) PLS-DA scores plot investigating the difference of cutaneous metabolome induced by UVB exposure in control mice. Points and ellipse as in Fig. 1. ROC analysis with X variate 1–3 found the metabolomes to differ significantly (p < 0.01) with an AUC of 1. (B) Corresponding PLS-DA loadings plot to (A) (points = metabolites as in Fig. 1) showing that unknown metabolites strongly differ after UV exposure. (C) PLS-DA scores plot investigating the difference of cutaneous metabolome induced by UVB exposure in GF mice. Points and ellipse as in Fig. 1. ROC analysis with X variate 1–3 found the metabolomes to differ significantly (p < 0.01) with an AUC of 1. (D) Corresponding PLS-DA loadings plot to (C) (points = metabolites as in Fig. 1) showing that unknown metabolites strongly differ after UV exposure. (E) Dumbbell plot of all significant LOGLME metabolites (p < 0.05) in any of the two comparisons: control mice vs GF before UVB exposure (orange) or after UVB exposure (yellow). The plot shows the strength of metabolic changes along the y-axis, significance is encoded in shapes (p < 0.05) indicating significant increase (sig. up), decrease (sig. down) or non-significant (non-sig). Note how there are much fewer significant differences after UV exposure (yellow). (F) Functional analysis of unknown metabolite changes induced by UVB exposure in control mice. Significantly impacted pathways are labelled above the dotted line (p < 0.05). (G) Functional analysis of unknown metabolite changes induced by UVB exposure in the absence of any microbiome (GF). Only significantly impacted pathways are labelled (p < 0.05). N = 6–10 mice per experimental group. Data is pooled from two independent experiments.

