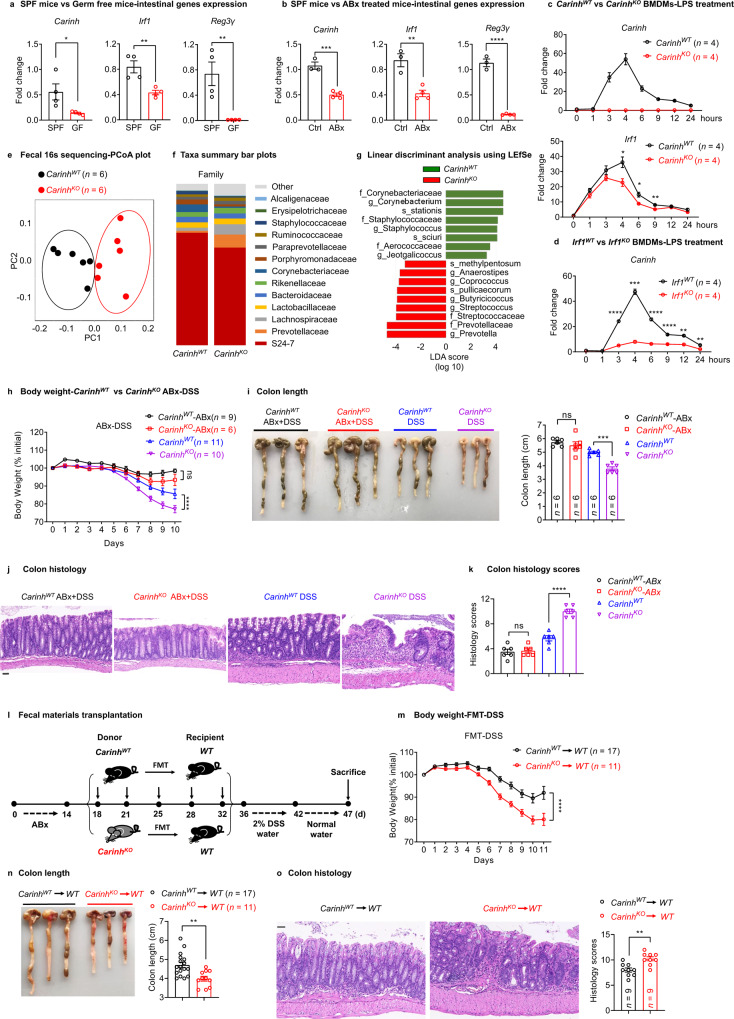
Fig. 4. Intestinal microbiota sustains the expression of a Carinh/IRF1 feedforward loop to maintain microbial homeostasis.
a, b qPCR analysis of Carinh, Irf1 and Reg3γ mRNA expression in the intestine from SPF and GF mice (a) (n = 4 mice per group), or from ABx-treated and untreated mice (b) (Ctrl n = 3 mice, ABx n = 4 mice). c, d qPCR analysis of Carinh and Irf1 mRNA levels in CarinhKO BMDMs (c), Irf1KO BMDMs (d), and their littermate controls in response to LPS stimulation with time-course. n = 4 per group. e Fecal 16S rDNA sequencing results for CarinhKO mice and their littermates. PCoA plot generated from unweighted UniFrac distance matrix displaying the distinct clustering pattern for the intestinal bacteria communities of CarinhKO mice and their littermates. f Relative abundance of taxonomic groups averaged across CarinhKO mice and their littermates at the family level. g Composition differences of the intestinal microbiota in CarinhKO mice and their littermates, determined by linear discriminant analysis using LEfSe. h–k DSS induced colitis model in ABx-treated or untreated CarinhKO mice and their littermates. Colitis was monitored by body weight loss (h), colon shortening (i), and H&E staining of colon tissues (j, k). j Representative pictures. Scale bars, 50 μm. k Quantification of corresponding histology scores. 5 views per mice, 6 mice per group. l Fecal microbiota from CarinhWT and CarinhKO mice were transferred into ABx-treated WT recipients. And then colitis was induced by DSS in the FMT recipient mice. m–o Colitis was monitored by body weight loss (m), colon shortening (n), and H&E staining of colon tissues (o). For H&E staining (o): left, representative pictures. Scale bars, 50 μm. Right, quantification of corresponding histology scores. 5 views per mice, 9 mice per group. 6 pairs of CarinhWT and CarinhKO mice were used in 16S rDNA sequencing experiments shown in e–g and were representative of two independent 16S rDNA sequencing experiments. Data in i, j, n and o are representatives of three independent experiments. Body weight data in h and m are pooled from two independent experiments. Data in a–d are representative of at least three independent experiments. Data represent means ± SEM. Body weight changes (h and m) were analyzed by two-way ANOVA. Colon length (i) and histology scores (k) were analyzed by one-way ANOVA. Unpaired two-tailed Student’s t-tests were used for other statistical analyses. *P < 0.05, **P < 0.01, ***P < 0.001, ****P < 0.0001; ns, not significant.

