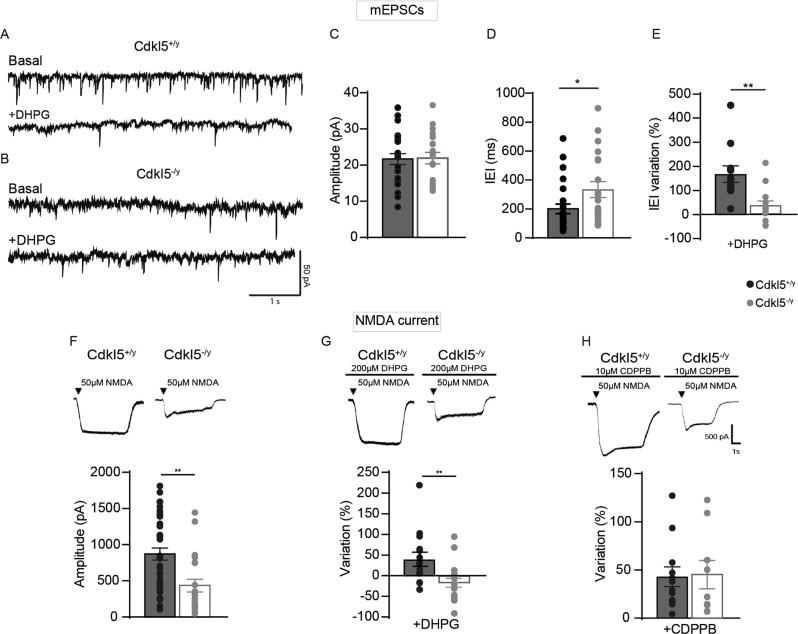
Fig. 2. CDKL5 loss tampers with both mEPSCs and NMDA current.
A Sample traces of miniature excitatory postsynaptic current (mEPSC) recorded from Cdkl5+/y neurons (A, upper part) and Cdkl5-/y neurons (B, upper part) and after the application of DHPG (A, B lower part). C, D Bar graphs showing the mean average amplitude (C) and the inter-event interval (IEI) of mEPSCs (D). E Bar graphs displaying the % of IEI variation IEI after the application of DHPG (100 µM). F Representative traces of currents obtained with patch-clamp recordings on S1 neurons cultures from Cdkl5+/y and Cdkl5-/y embryos after NMDA (50 µM) application (upper part), bar graphs showing differences of INMDA current between genotypes (lower part). G Representative traces of NMDA currents on S1 neurons after 2-min application of DHPG (100 µM-upper part); bar graphs showing the % change of INMDA after the application of DHPG (lower part). H Representative traces of NMDA after 2-min CDPPB + NMDA application (upper part), bar graphs showing the % change of INMDA current after the application of CDPPB (lower part). Student’s t-test, chi-square, two-way ANOVA followed by Fisher’s multiple comparison test, *p < 0.05, **p < 0.01, ***p < 0.001 (mEPSC Cdkl5+/y n = 22 cells, Cdkl5-/y n = 28; minis+DHPG Cdkl5+/y: n = 12 cells; minis+DHPG Cdkl5-/y: n = 13 cells. NMDA: Cdkl5+/y n = 36 cells, Cdkl5-/y n = 23 cells; NMDA + DHPG Cdkl5+/y n = 15 cells and NMDA + DHPG Cdkl5-/y n = 14 cells; NMDA + CDPPB Cdkl5+/y n = 12 cells; NMDA + CDPPB Cdkl5-/y n = 9 cells).

