FIG. 3.
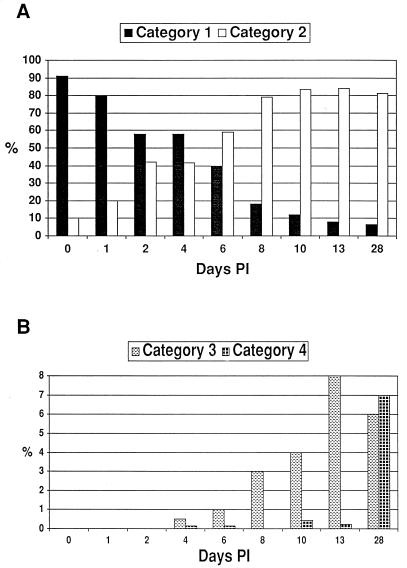
Changes in S6J colony pMGA1.1 and variant pMGA phenotypes with time p.i. (A) Bar graph comparing the average proportion of colonies in categories 1 and 2 (see Fig. 2) in the starting inoculum and from tracheal wash samples at various time points p.i. The total number of colonies counted for each time point ranged from 119 to 663. The mean proportions of category 1 and 2 colonies on days 2, 4, 6, 8, 13, and 28 were found to be significantly different from those on day 0 (P < 0.05). (B) Bar graph comparing the average proportion of colonies in categories 3 and 4 (see Fig. 2) in the starting inoculum and from tracheal wash samples at various time points p.i. The total number of colonies counted for each time point ranged from 119 to 663. The mean proportions of category 3 colonies on days 10, 13, and 28 were significantly different from the proportion seen on day 0 (P < 0.05). Only the mean proportion of category 4 colonies on day 28 was significantly different from that on day 0 (P < 0.05).

