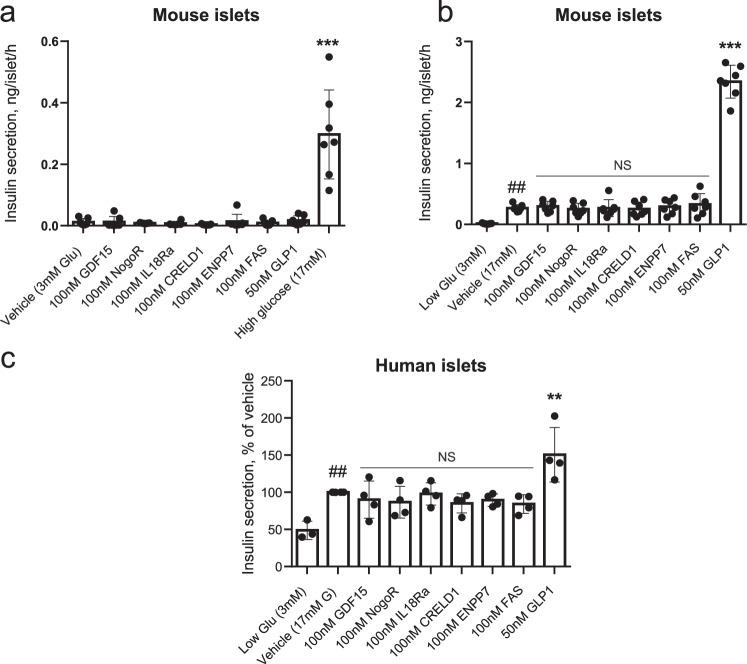
Fig. 4. Impact of identified biomarkers on insulin secretion from mouse (a, b) and human (c) islets.
Incubations were performed for 30 min. at the indicated concentrations of glucose, and secreted insulin measured using an electrochemiluminescence assay. a ***p = 3.19·10-14 for the effects of 17 mM vs 3 mM glucose. b ##p = 0.0074 for the effects of 17 mM vs 3 mM glucose and ***p < 2.2·10-16 for the effects of 50 nM GLP-1 vs 17 mM glucose. c **p = 0.0053 for the effects of 50 nM GLP-1 vs 17 mM glucose and ##p = 0.0097 for the effects of 17 vs 3 mM glucose. Comparisons by one-way ANOVA in each case. Data points n = 7 replicates per treatment using islets from 16 mice (a, b) or those from individual human subjects (n = 4; c). Error bars represent means ± S.D. Other details are given in the Methods Section. Source data are provided as a Source Data file.

