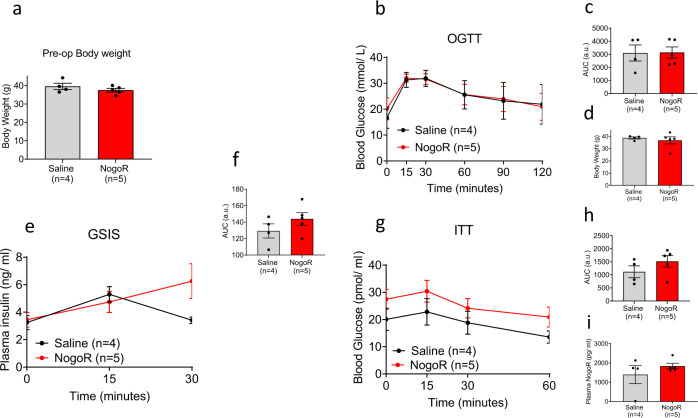
Fig. 7. NogoR has marginal effects on glucose clearance and insulin sensitivity in db/db mice.
a Body weights of db/db cohort pre-NogoR treatment n = 4–5. b–d Body weights, blood glucose levels and Area Under the Curve (AUC) after an oral glucose load (2 g/kg) 4 weeks after continuous NogoR treatment. n = 4–5. e, f Corresponding plasma insulin levels and AUC after oral glucose load (2 g/kg) shown in b. n = 4–5 per group. g, h Circulating glucose levels and corresponding AUC after receiving an intraperitoneal injection of 1 IU/kg of insulin. i Circulating NogoR levels 4 weeks after continuous treatment. Data are mean ± SEM. Source data are provided as a Source Data file. Data in b, e, and g were analyzed by multiple unpaired Student’s t-test, and those in a, c, d, f, h, i by Mann–Whitney test. No significant statistical differences were detected.

