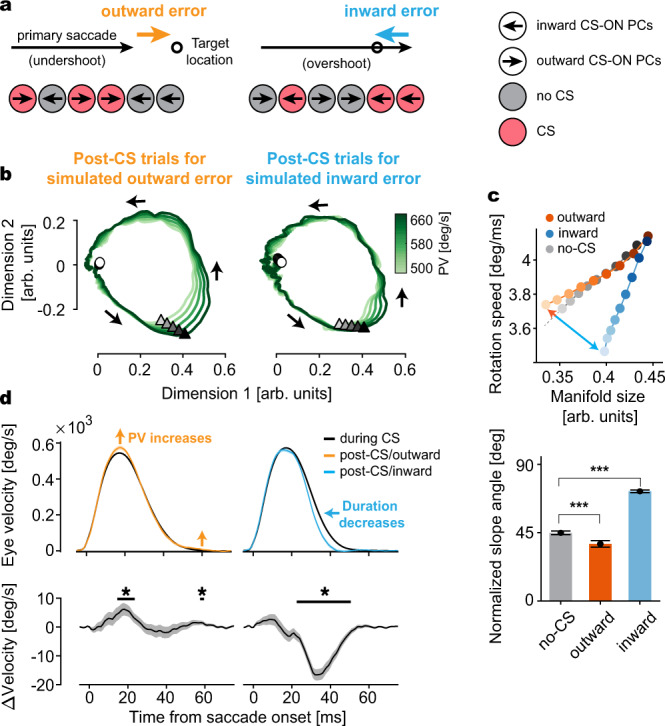
Fig. 5. Complex spike (CS)-driven plasticity of PC manifolds is error-state dependent and predicts eye movement change.

a Two different types of eye movement errors and CS firing in PCs encoding the errors. Left: An undershooting eye movement causes an outward error (orange) and CS firing in a population of PCs with the same CS-ON direction (red) but not in the other, CS-OFF PCs (gray). Right: Same as Left for an overshooting saccade causing an inward error (blue). b Left: PC manifolds reflecting the combined influence of simulated outward error-encoding CS firing pattern on a particular trial, obtained by combining CS trials of CS-ON PCs (red circles) and no-CS trials of CS-OFF PCs (gray circles), on subsequent trials. Note that, in simulated error trials we assume that CS-ON PCs reported an error by firing a CS during 50–140 ms after saccade offset, whereas CS-OFF PCs reported the same error by not firing a CS, irrespective of the actual presence of an error. Right: same as Left, but for the inward error. c Top: manifold size versus rotation speed after the outward (orange) and inward (blue) error-encoding CS trials, and after no-CS trials (gray). Color bar gradient represents PV from 500 deg/s (brightest) to 660 deg/s (darkest). Bottom: comparison of normalized slope angles for each condition. Data are jackknife mean ± SEM from n = 151 PCs. T-val (No-CS, Outward) = 4.11; ***: p = 3.18 × 10⁻⁵, T-val (Outward, Inward) = −20.76; ***: p = 2.20 × 10−46, T-val (No-CS, Inward) = −25.33; ***: p = 1.54 × 10−56. p Values are from one-sided Student’s t tests. d Top: average saccade velocity profiles in the CS (black) and post-CS trials (colored) for the simulated outward (left) and inward (right) errors. For highlighting the differences in velocity profiles, colored lines represent the cumulative effect of five CSs. Bottom: average eye velocity change from the CS to post-CS trials. Data are mean ± SEM. *p < 0.05 (two-sided Student’s t test).
