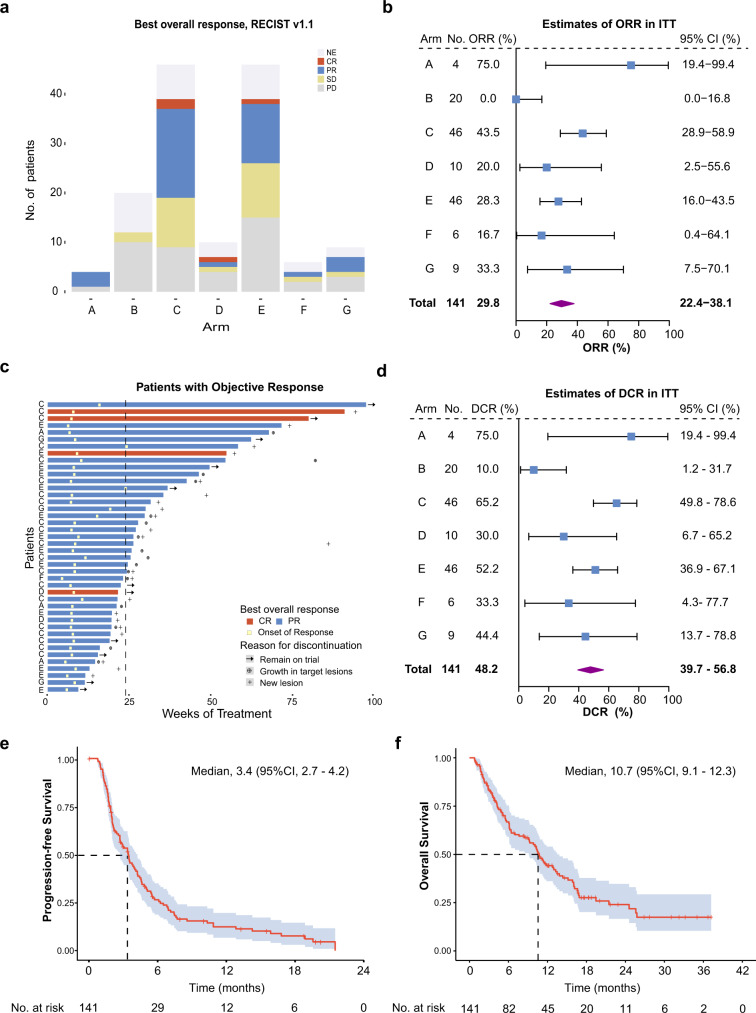
Fig. 2. Summary of the primary and secondary endpoints.
a Summary of confirmed responses according to RECIST v1.1 in each arm in the ITT population. b Forest plots of the ORR and 95% CI of each arm in the ITT population. c Durability of response among 42 patients with a confirmed objective response. The dashed line is at 24 weeks of treatment. d Forest plots of the DCR and 95% CI of each arm in the ITT population. e, f Kaplan‒Meier analysis of PFS (e) and OS (f) in the ITT population. RECIST response evaluation criteria in solid tumors, NE not evaluated, CR complete response, PR partial response, SD stable disease, PD progressive disease, ORR objective response rate, ITT intention-to-treat, CI confidence interval, DCR disease control rate.

