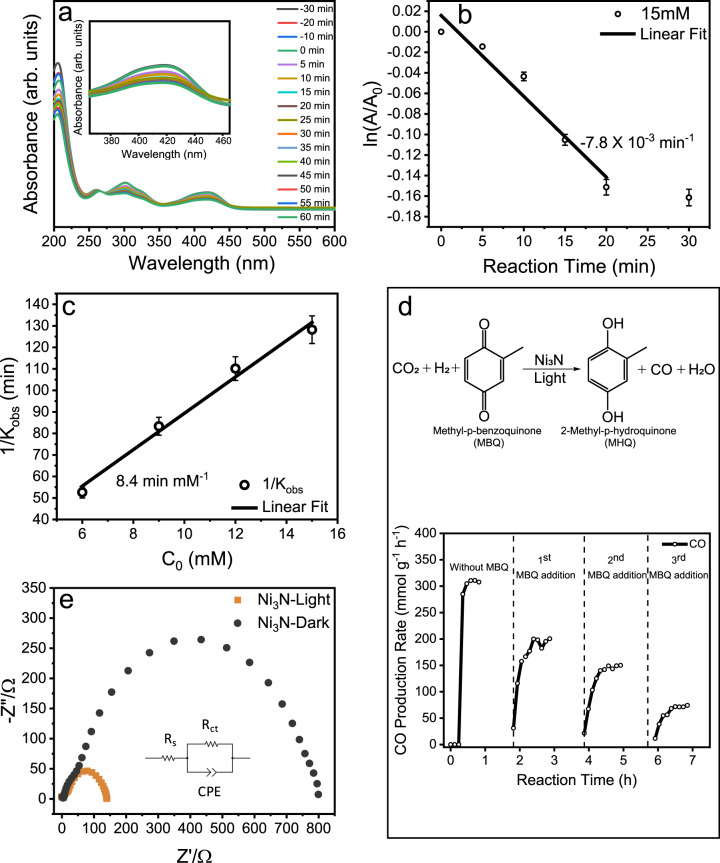
Fig. 7. Electron transfer studies of Ni3N nanosheets.
a UV-Vis spectra showing the conversion of Fe3+ to Fe2+ as a function of irradiation time, using 15 mM K3[Fe(CN)6]. Inset: Magnified UV-Vis spectra around 419 nm; b Pseudo-first-order plot of ln(A/A0) against reaction time; c Langmuir–Hinshelwood plot of the reciprocal of observed pseudo-first-order rate constant as a function of initial ferricyanide concentration. d CO production rate of photocatalytic CO2 hydrogenation reaction in the presence of methyl-p-benzoquinone (MBQ). Each MBQ addition corresponds to the addition of 50 µL of 1 M solution of MBQ in diethyl ether; e Nyquist plots of Ni3N nanosheets in dark and light, where Z′ is real impedance, and Z″ is imaginary impedance. Error bars: calculated from data of at least three repeated experiments.

