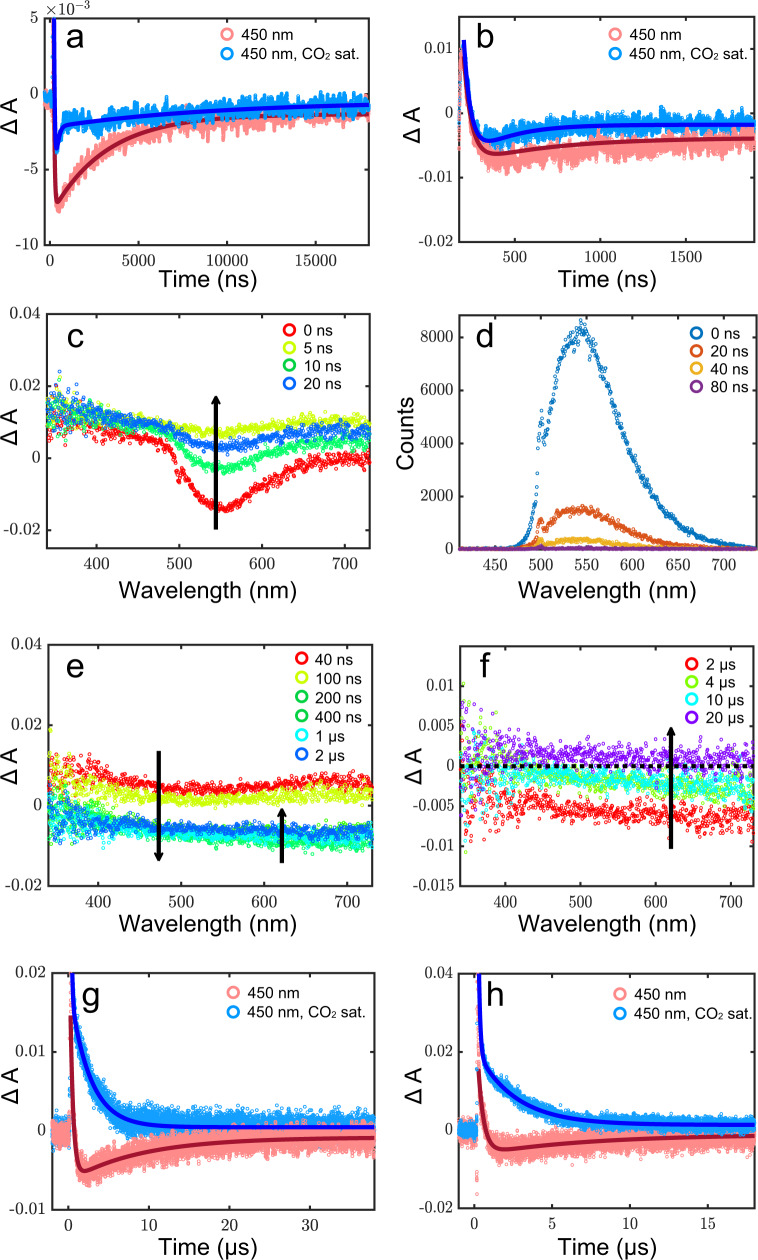
Fig. 9. Nanosecond transient absorption spectroscopy study.
a, b Representative kinetics monitored at 450 nm for the as-prepared Ni3N nanosheets after photoexcitation at 500 nm (pulse energy = 10 mJ/pulse), with (blue) and without (pink) CO2 saturation (Solid lines are fits); Transient absorption and emission spectra monitored c, d at indicated initial timescales and e, f at later timescales, upon excitation of the as-synthesized Ni3N nanosheets in ethanol suspension at 500 nm (pulse energy = 10 mJ/pulse); g, h Representative kinetics monitored at 450 nm for the heated Ni3N nanosheets after photoexcitation at 500 nm (pulse energy = 10 mJ/pulse), with (blue) and without (pink) CO2 saturation (solid lines are fits). The right panels (b, h) show data of the initial timescales on the left panel (a, g), respectively, with a greater resolution so that the rise can be seen.

