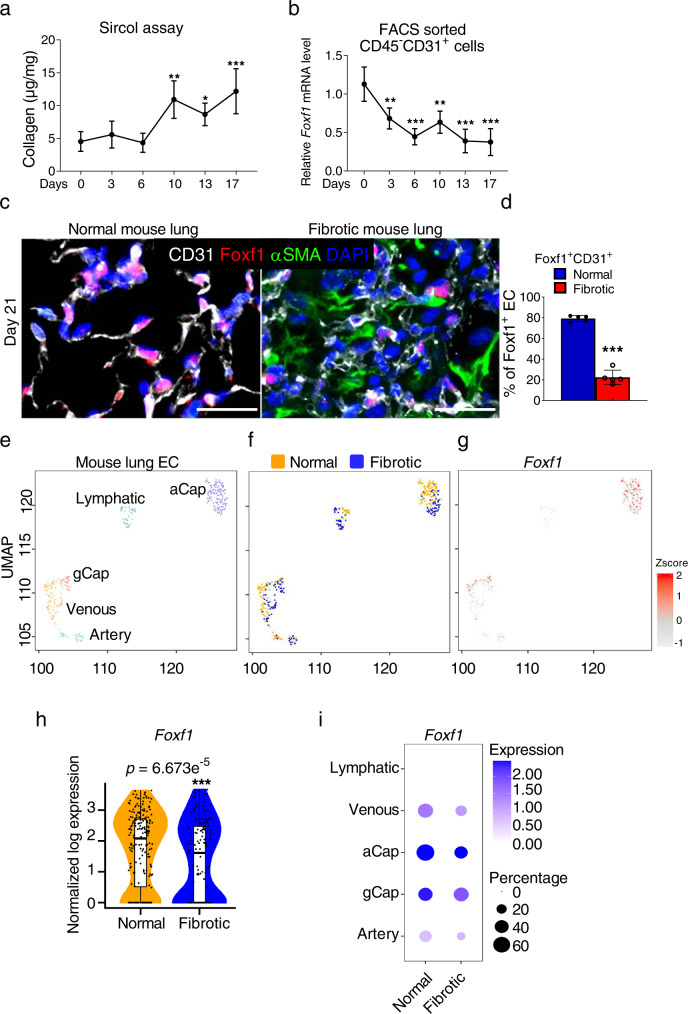
Fig. 2. Expression of FOXF1 is decreased in endothelial cells within fibrotic lesions of mouse lungs.
a Time-dependent accumulation of collagen in murine lungs after chronic bleomycin injury is quantified using Sircol collagen assay. Wild type mice were treated with three weekly IT injections of bleomycin to induce lung fibrosis (Day0, 3, 6, 10, 17, n = 4 mice per group; Day 13, n = 6 mice). b Time-dependent decrease of Foxf1 mRNA is shown in FACS-sorted lung endothelial cells during lung fibrogenesis using qRT-PCR (Day 0, 6,10, n = 3; Day 3, n = 4; Day13 n = 7; Day 17, n = 8, mice per group). c Co-localization studies show decreased FOXF1 in endothelial cells and decreased number of FOXF1+ endothelial cells within lung fibrotic foci at day 21 after bleomycin treatment. Mouse normal lungs (n = 5) and bleomycin-treated lungs (n = 5) were stained with antibodies against FOXF1 (red), CD31 (white) and αSMA (green). DAPI (blue) was used to visualize the nuclei. Bar = 25 µm. d Percent of FOXF1+/CD31+ double positive cells among CD31+ cells were counted in 5 random fields and presented as mean ± SD (n = 5 mice per group). ***p < 0.001. The integrated projection of lung EC from normal and bleomycin-treated fibrotic lungs (e, colored by cell type. f, yellow- normal lungs; blue- fibrotic lungs). Single cell RNA-seq was performed using pooled normal controls (n = 4) and bleomycin-treated (n = 6) mouse lungs. g UMAP plots show Foxf1 expression in endothelial cells of normal and fibrotic mouse lungs after Z-score normalization. h Violin plots show decreased expression of Foxf1 mRNA in ECs from fibrotic lungs. i Both Foxf1 mRNA expression and the frequency of Foxf1-positive cells are decreased in venous, aCap, gCap, and arterial endothelial cells from fibrotic lungs. Foxf1 is not expressed in lymphatic endothelial cells. Foxf1 expression is log normalized. Data presented as mean ± SD. *p < 0.05, **p < 0.01, ***p < 0.001. For two group comparisons, T-test (two-tailed) analyses were performed. For more than two group, statistical significance was determined by one-way ANOVA followed by Dunnett’s test. Source data are provided as a Source Data file.

