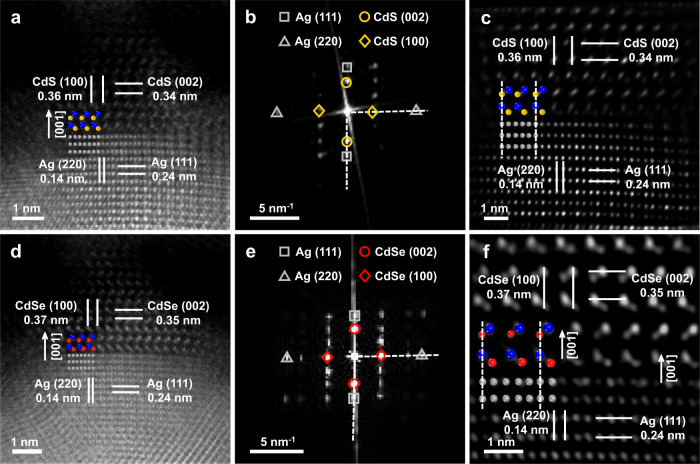
Fig. 2. Characterization of epitaxial interfaces in Ag-CdS and Ag-CdSe heterostructures obtained at a short reaction time of 1 min.
a Cs-HAADF-STEM image of the Ag-CdS interface. b, c The FFT pattern (b) and inverse FFT image (c) of the Ag-CdS interface. The silver square and silver triangle in (b) are applied to mark the FFT spots indexed to Ag (111) and Ag (220), respectively. The yellow circle and yellow rhombus are applied to mark the FFT spots indexed to CdS (002) and CdS (100), respectively. d Cs-HAADF-STEM image of the Ag-CdSe interface. e, f The FFT pattern (e) and inverse FFT image (f) of the Ag-CdSe interface. The silver square and silver triangle in (e) are applied to mark the FFT spots indexed to Ag (111) and Ag (220), respectively. The red circle and red rhombus are applied to mark the FFT spots indexed to CdSe (002) and CdSe (100), respectively. The silver, blue, yellow, red balls in (a), (c), (d), (f) represent the scheme of Ag, Cd, S, Se atoms, respectively.

