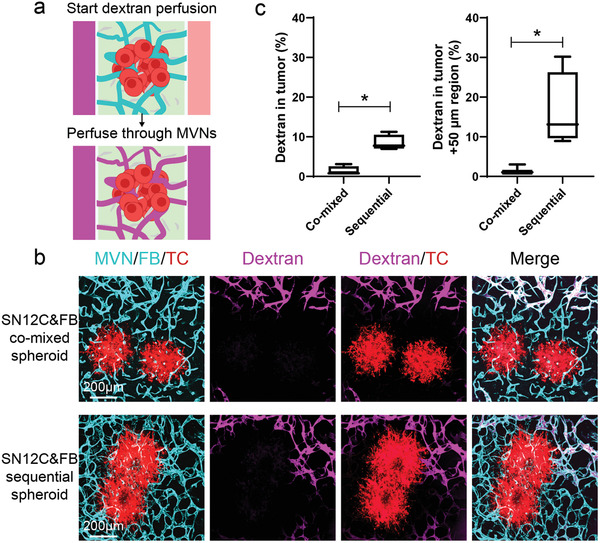
Figure 3.

Perfusability of tumoral vessels in co‐mixed and sequential tumor spheroids. a) Schematic showing dextran perfusion in tumor vessels. b) Representative confocal images of vascularized SN12C co‐mixed or sequential tumor spheroids perfused with fluorescein dextran (10 kDa) on day 7. Device was imaged within 5 min after perfusing dextran. c) Statistical analysis of dextran percentage in the tumor region and tumor +50 µm region. Bars represent mean ± S.D. Two‐tailed t tests were performed for the statistical comparisons. Data were collected from at least 6 tumor spheroids for each group. *p < 0.05.
