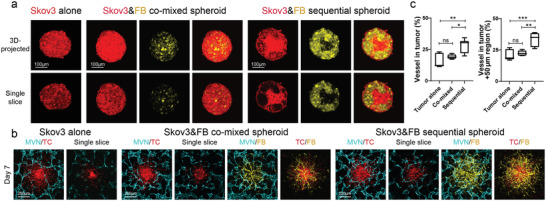
Figure 4.

Vascularized Skov3 tumor spheroid model. a) Representative confocal images of Skov3 tumor spheroids formed by the three different methods. b) Representative confocal images of vascularized Skov3 tumor spheroids on day 7. c) Statistical analysis of vessel percentage in the tumor region (left) and tumor +50 µm region (right). Bars represent mean ± S.D. One‐way ANOVA was performed for the statistical comparison. Vessel in tumor, p < 0.01 and tumor +50 µm region, p < 0.001. Significance determined by Tukey's multiple comparisons test of mean values between each group. Data were collected from at least 5 tumor spheroids for each group. *p < 0.05, **p < 0.01, ***p < 0.001.
