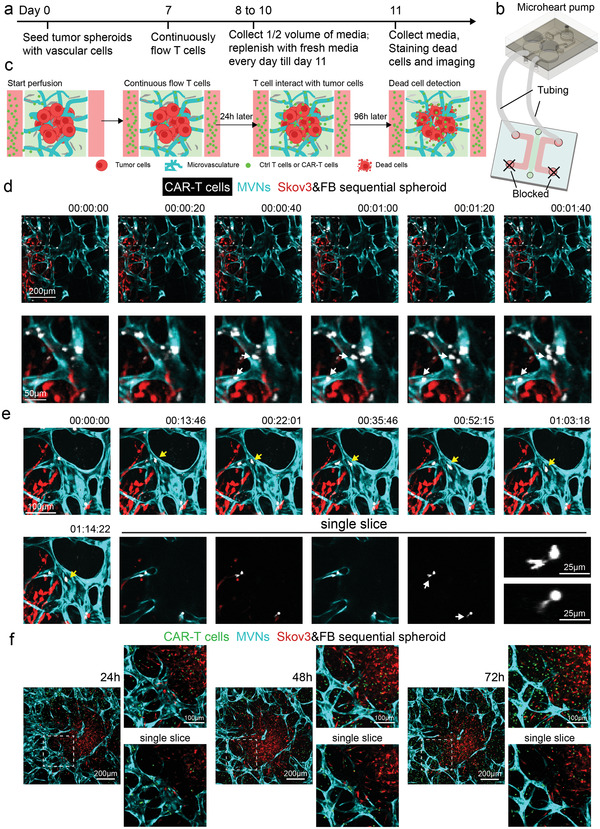
Figure 5.

Vascularized tumor spheroid model can be used to study CAR‐T cell transport. a) Experimental procedure for continuous flow of T cells in vascularized tumor spheroid models. Control T cells or CAR‐T cells are perfused on day 7 and recirculated for 4 days. Half‐volume of conditioned media in the devices is collected every 24 h and replenished. On day 11, devices are stained with Nuclear Blue DCS1 to indicate dead cells. b,c) Sketch of continuously flow T cells in the vascularized tumor spheroid model. One reservoir of each media channel is connected to the microheart pump by tubing, while the two other reservoirs are blocked to create a closed loop and continuous flow. d) Time lapse images of CAR‐T cells flowing into the MVNs. A majority of the CAR‐T cells travel through the MVNs quickly with some of the cells adhering to the apical surface of the vessels close to the tumor region. White arrows point to freshly adhered T cells during the time of imaging. e) Time lapse images of CAR‐T cells migration and extravasation. Yellow arrows identify a T cell patrolling in the vessels. Single slice images highlight T cells undergoing extravasation. White arrows identify the portions of the cell that have extravasated. Zoomed‐in images of these two T cells are provided. f) Representative images of CAR‐T cell responses in the vascularized sequential tumor spheroid group at 24, 48, and 72 h time points.
