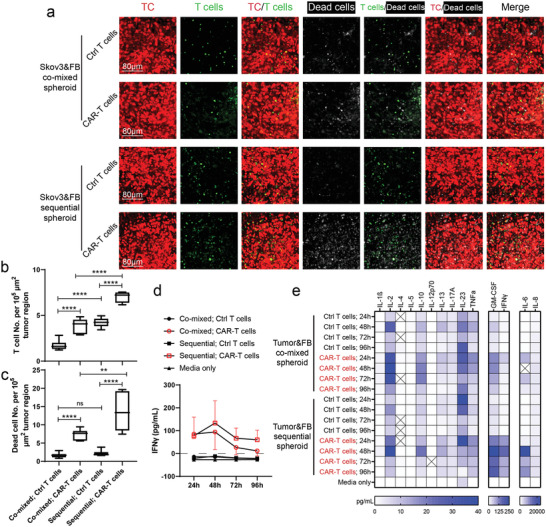
Figure 6.

Vascularized tumor spheroid model can be used to assess CAR‐T cell killing efficiency and cytokine secretion. a) Representative 3D projected confocal images of T cells and dead cells in vascularized tumor spheroids formed by co‐mixed or sequential methods. ECs were not labeled. Statistical analysis of b) T cell or c) dead cell number per 105 µm2 tumor region. Bars represent mean ± S.D. Two‐tailed t tests were performed for the statistical comparisons. Data were collected from at least 6 tumor spheroids for each group. **p < 0.01, ****p < 0.0001. d) IFNγ concentration of conditioned media in each group over 96 h. Samples were collected from 3 devices for each group and tested using traditional ELISA methods. e) Luminex multiplex ELISA assay of conditioned media from co‐mixed or sequential tumor spheroid group perfused with control T cells or CAR‐T cells for 24, 48, 72, and 96 h. Pooled media from 3 devices in each group was used for analysis.
