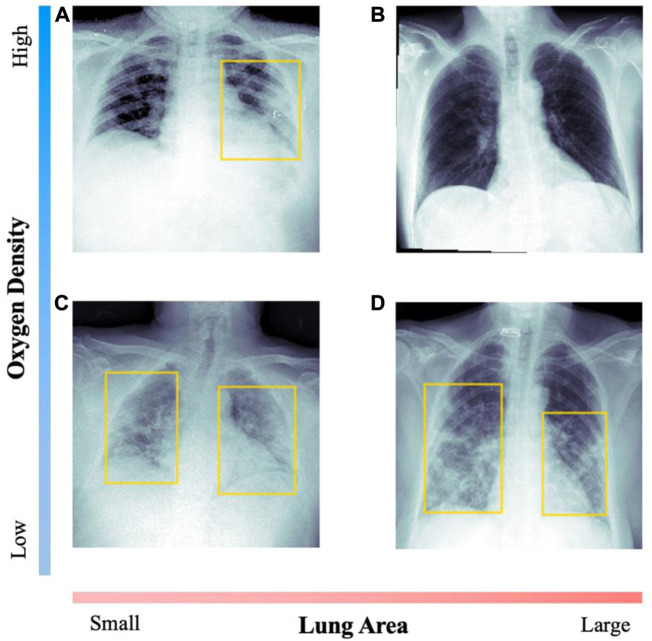
FIGURE 2.
Comparison of radiographs with opposed values on the diagnosis variables. For each image, the patient’s data is included. Yellow boxes indicate lung opacity detection. Image (A) corresponds to a 47-year-old woman, with medium saturation; (B) to a 53-year-old man with adequate saturation; (C) to an 82-year-old man with extreme saturation; (D) to a 72-year-old woman with low saturation.

